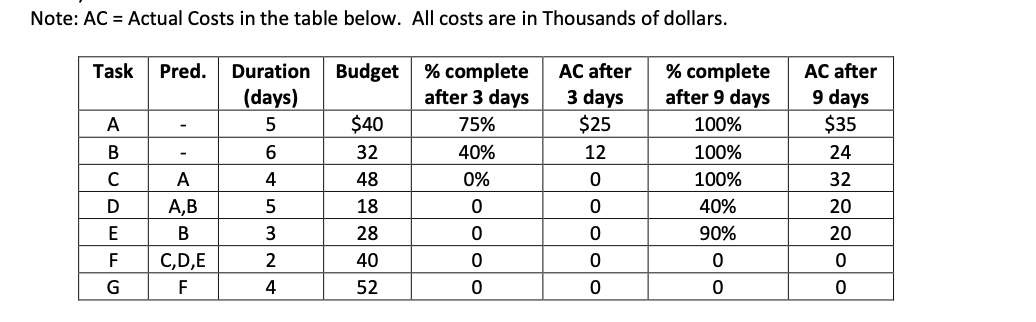
Note: AC = Actual Costs in the table below. All costs are in Thousands of dollars. Task Budget AC after 3 days $25 12 AC after 9 days $35 24 25 A B C Pred. Duration (days) - 5 - 6 A 4 A ,B 5 B 3 C ,D,E 2 F 4 % complete after 9 days 100% 100% 100% 40% 90% % complete after 3 days 75% 40% 0% 0 0 0 0 0 32 $40 32 48 18 28 40 52 D | 0 E F G 0 1. This problem should be worked by hand or Excel, not using Microsoft Project. Calculate the following: a. EV and PV for each task and the total for the project for each reporting period. b. The CV, SV, CPI and SPI, and budget forecasting, ETC and EAC, totals for the project (you do not have to calculate for each task) at each of those reporting periods. C. What can you say about the health of the project overall? Be specific 2. Rework the information for parts a and b of problem 1 using the 20/80% rule for the percent completion. Any change in the health? 3. Rework problem 1 using MSP but as shown below. You will upload your msp file into Canvas AND upload a word document with three tables for each status date: The WBS and Gantt chart (entry table), The Tracking table The Earned Value table. To do this, go into microsoft project under the Task tab and click on copy picture (pull down) and then paste into a word document. You should put both status days (3 charts for each) into one document. Your project should have a overall summary task and show: WBS numbers, critical path and status date on the Gantt chart for both status days. Assume a standard work week (5 days) with no holidays. a. Calculate EV and PV, CV, SV, CPI and SPI and EAC for each task and the total for the project for each time period. (add CPI and SPL into the EV table). Note: MSP does not calculate ETC. b. Which tasks have a different EV value than in problem 1? Why? Note: AC = Actual Costs in the table below. All costs are in Thousands of dollars. Task Budget AC after 3 days $25 12 AC after 9 days $35 24 25 A B C Pred. Duration (days) - 5 - 6 A 4 A ,B 5 B 3 C ,D,E 2 F 4 % complete after 9 days 100% 100% 100% 40% 90% % complete after 3 days 75% 40% 0% 0 0 0 0 0 32 $40 32 48 18 28 40 52 D | 0 E F G 0 1. This problem should be worked by hand or Excel, not using Microsoft Project. Calculate the following: a. EV and PV for each task and the total for the project for each reporting period. b. The CV, SV, CPI and SPI, and budget forecasting, ETC and EAC, totals for the project (you do not have to calculate for each task) at each of those reporting periods. C. What can you say about the health of the project overall? Be specific 2. Rework the information for parts a and b of problem 1 using the 20/80% rule for the percent completion. Any change in the health? 3. Rework problem 1 using MSP but as shown below. You will upload your msp file into Canvas AND upload a word document with three tables for each status date: The WBS and Gantt chart (entry table), The Tracking table The Earned Value table. To do this, go into microsoft project under the Task tab and click on copy picture (pull down) and then paste into a word document. You should put both status days (3 charts for each) into one document. Your project should have a overall summary task and show: WBS numbers, critical path and status date on the Gantt chart for both status days. Assume a standard work week (5 days) with no holidays. a. Calculate EV and PV, CV, SV, CPI and SPI and EAC for each task and the total for the project for each time period. (add CPI and SPL into the EV table). Note: MSP does not calculate ETC. b. Which tasks have a different EV value than in problem 1? Why