 Note: Answer 3,6 and 9 only using Matlab and provide graphs
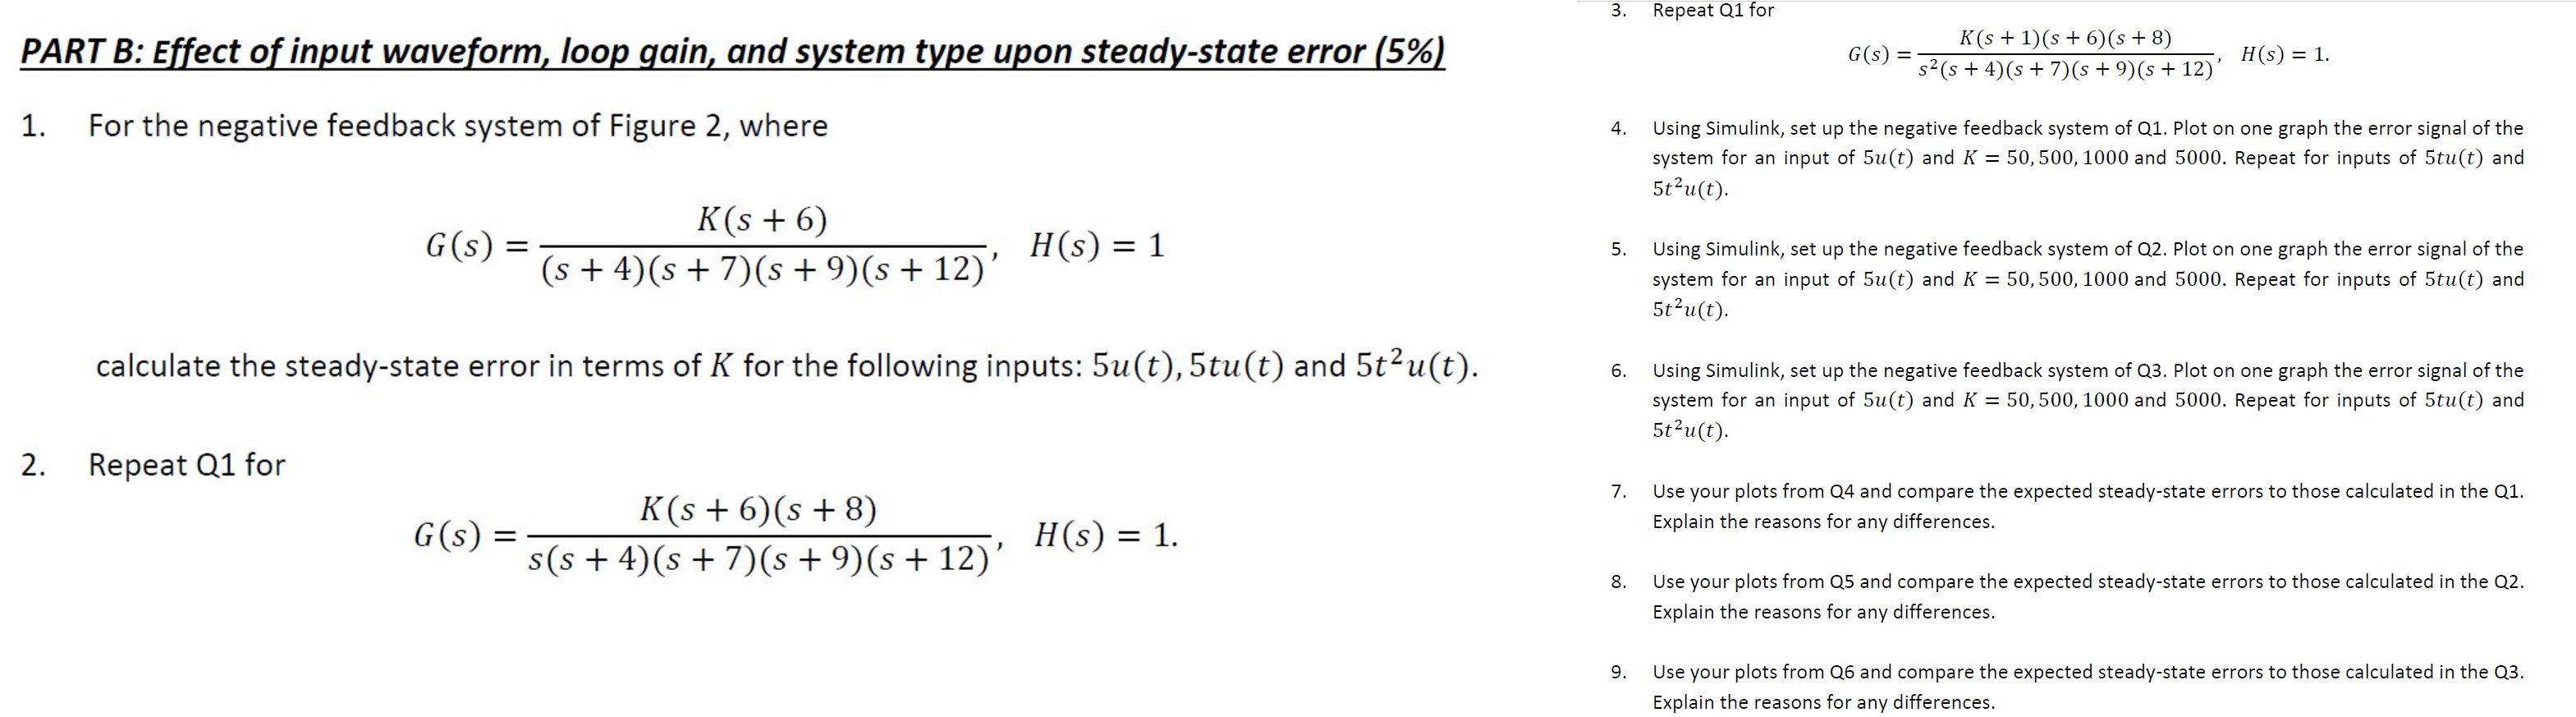
3. Repeat Q1 for PART B: Effect of input waveform, loop gain, and system type upon steady-state error (5%). G(s) K(s + 1)(s + 6)(s + 8) s-(s + 4)(8 + 7)(s +9)(s + 12)' H(s) = 1. 1. For the negative feedback system of Figure 2, where 4. Using Simulink, set up the negative feedback system of Q1. Plot on one graph the error signal of the system for an input of 5u(t) and K = 50,500,1000 and 5000. Repeat for inputs of 5tu(t) and 5t?u(t). G(s) = K(S + 6) (s + 4)(s + 7)(8 + 9) (s + 12) H(S) = = 1 5. Using Simulink, set up the negative feedback system of Q2. Plot on one graph the error signal of the system for an input of 5u(t) and K = 50,500,1000 and 5000. Repeat for inputs of 5tu(t) and 5t2u(t). calculate the steady-state error in terms of K for the following inputs: 5u(t),5tu(t) and 5t2u(t). 6. Using Simulink, set up the negative feedback system of Q3. Plot on one graph the error signal of the system for an input of 5u(t) and K = 50,500,1000 and 5000. Repeat for inputs of 5tu(t) and 5t2u(t). 2. Repeat Q1 for 7. Use your plots from Q4 and compare the expected steady-state errors to those calculated in the Q1. Explain the reasons for any differences. K(S + 6) (S + 8) s(s + 4)(s + 7)(s +9) (s + 12) G(S) HS) = 1. 8. Use your plots from Q5 and compare the expected steady-state errors to those calculated in the Q2. Explain the reasons for any differences. 9. Use your plots from Q6 and compare the expected steady-state errors to those calculated in the Q3. Explain the reasons for any differences. 3. Repeat Q1 for PART B: Effect of input waveform, loop gain, and system type upon steady-state error (5%). G(s) K(s + 1)(s + 6)(s + 8) s-(s + 4)(8 + 7)(s +9)(s + 12)' H(s) = 1. 1. For the negative feedback system of Figure 2, where 4. Using Simulink, set up the negative feedback system of Q1. Plot on one graph the error signal of the system for an input of 5u(t) and K = 50,500,1000 and 5000. Repeat for inputs of 5tu(t) and 5t?u(t). G(s) = K(S + 6) (s + 4)(s + 7)(8 + 9) (s + 12) H(S) = = 1 5. Using Simulink, set up the negative feedback system of Q2. Plot on one graph the error signal of the system for an input of 5u(t) and K = 50,500,1000 and 5000. Repeat for inputs of 5tu(t) and 5t2u(t). calculate the steady-state error in terms of K for the following inputs: 5u(t),5tu(t) and 5t2u(t). 6. Using Simulink, set up the negative feedback system of Q3. Plot on one graph the error signal of the system for an input of 5u(t) and K = 50,500,1000 and 5000. Repeat for inputs of 5tu(t) and 5t2u(t). 2. Repeat Q1 for 7. Use your plots from Q4 and compare the expected steady-state errors to those calculated in the Q1. Explain the reasons for any differences. K(S + 6) (S + 8) s(s + 4)(s + 7)(s +9) (s + 12) G(S) HS) = 1. 8. Use your plots from Q5 and compare the expected steady-state errors to those calculated in the Q2. Explain the reasons for any differences. 9. Use your plots from Q6 and compare the expected steady-state errors to those calculated in the Q3. Explain the reasons for any differences