Answered step by step
Verified Expert Solution
Question
1 Approved Answer
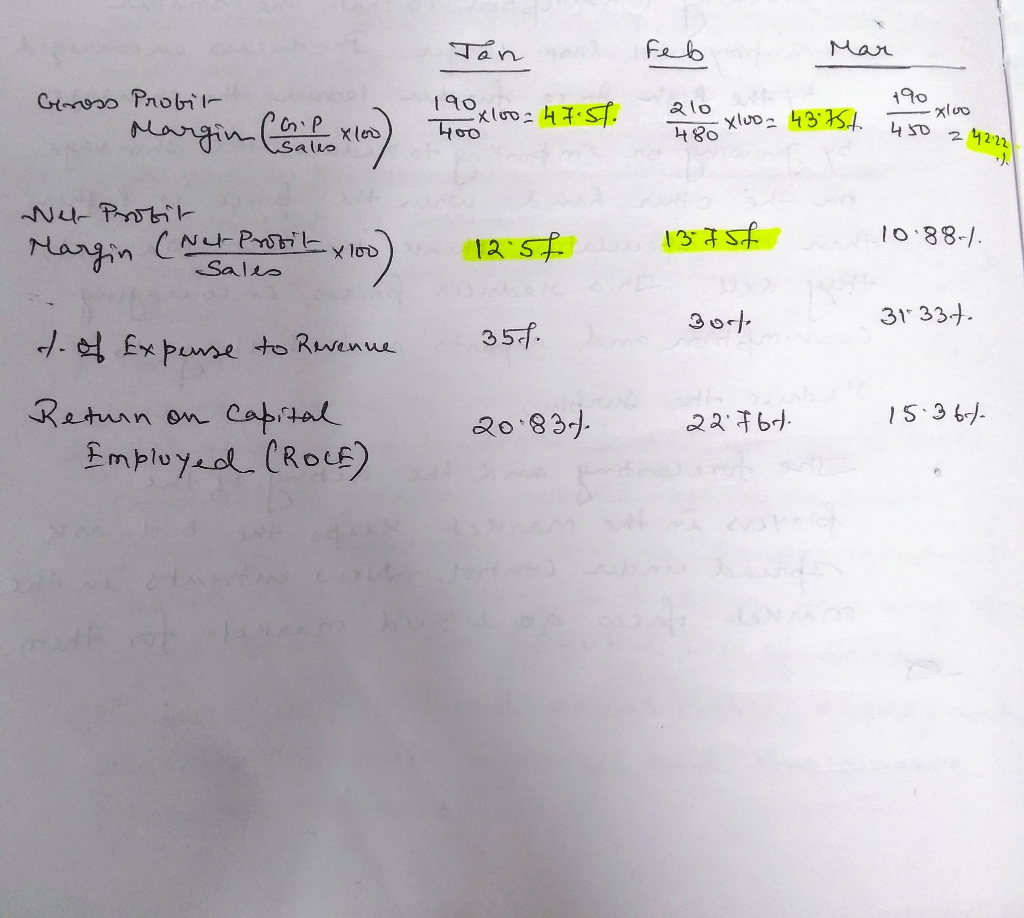
Note: Answers should be typed in Word Version and Format Please Tan Feb Mar Gross Probil 190 190x1vo2 17:57 - X100= 43 754 450 242:22


Note: Answers should be typed in Word Version and Format Please
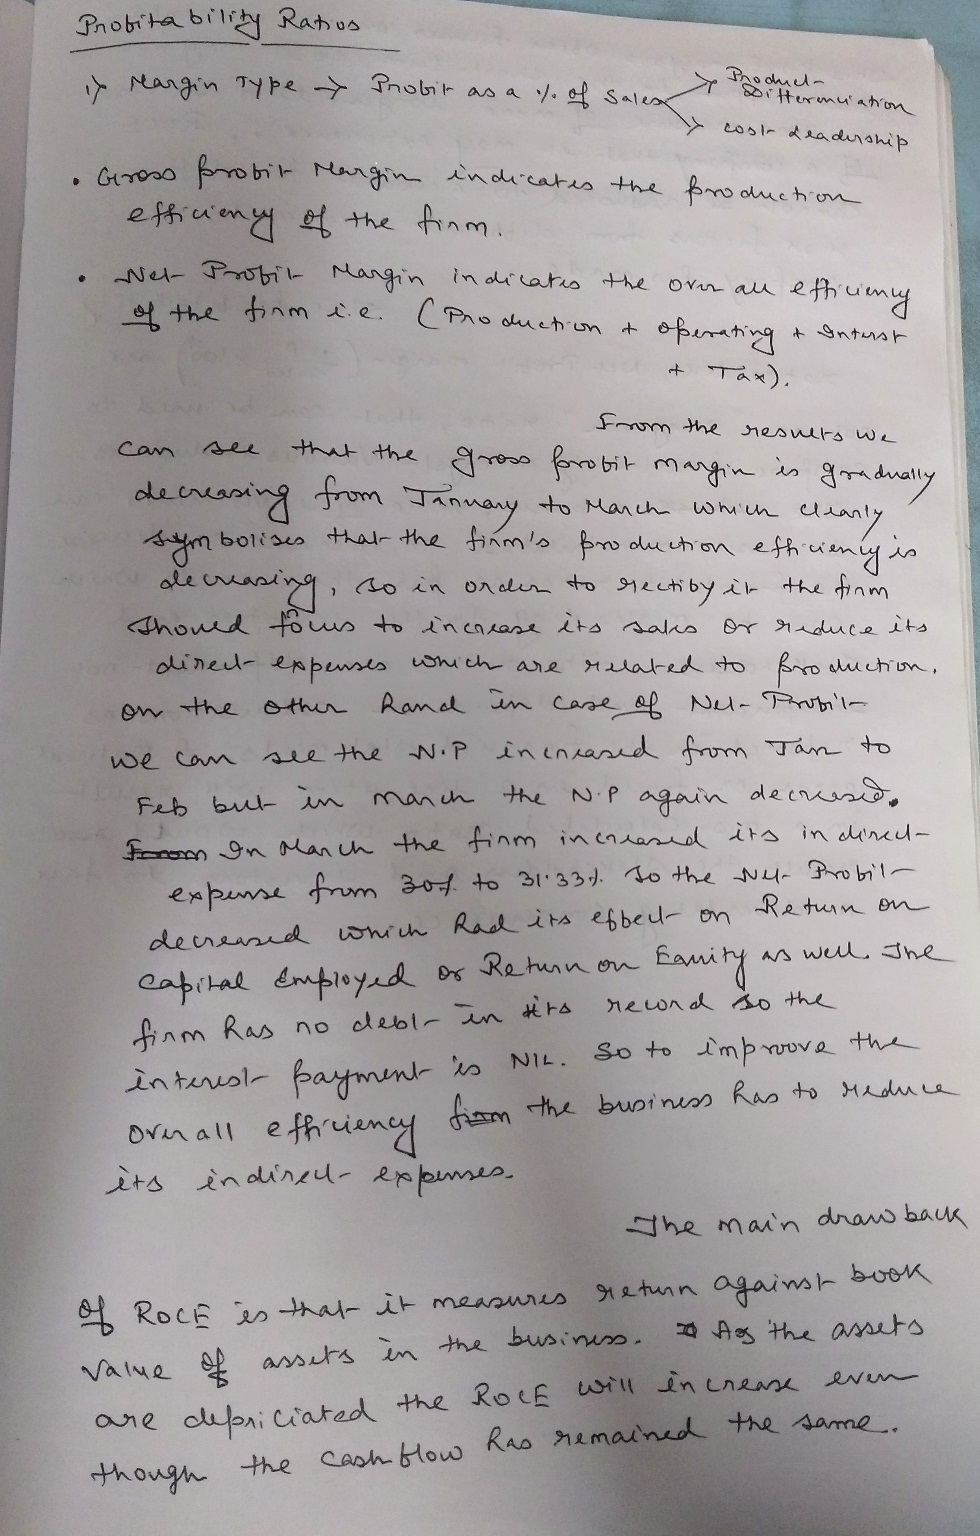
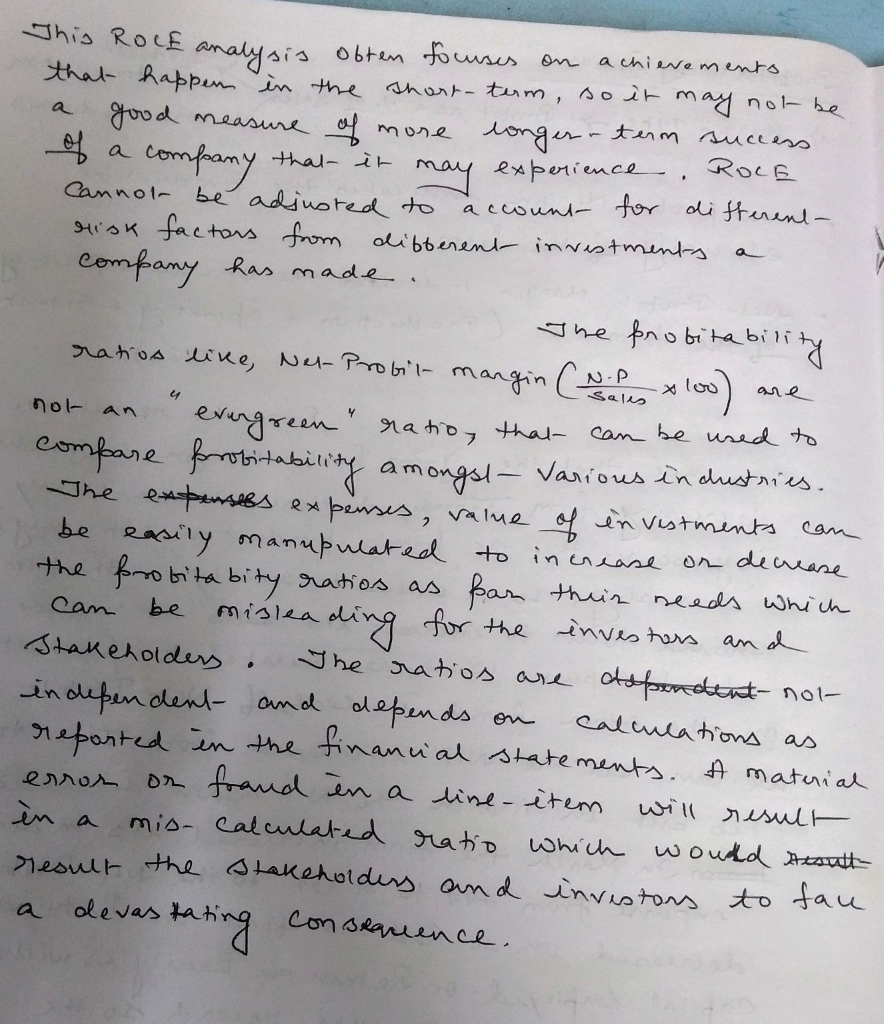
Tan Feb Mar Gross Probil 190 190x1vo2 17:57 - X100= 43 754 450 242:22 xlvo Margin Call xD alo 480 400 Wer Profit 12.57 13 7 st Margin (Net Probit x100 10.88-1 Sales Bot 31 33.7. 35% d. of Expense to Revenue Return on capital Employed CROCE) 20.834 22 767 15.367 Profitability Ratios iy Margin Type > Probit as a % of Salex Product- Bittermuation y cost Leadership Gross krobit Margin indicates the production efficiency of the firm. Wet Probit Margin indicates the over all efficiency of the firm i.e. (Production & operating it Tax). & Intust From the results we can that the efficiency or reduce its we can see the gross forotit margin is gradually decreasing from January to March which clearly bolises that the firm's production en y is decreasing, so in order to erectity in the firm Thoned tours to increase its sakes. direct expenses which are related to production, on the other hand in case of Nela Profil W.P ncneased from Tan to Feb but in manch N. P again decreased. Forom on March the firm increased its in directa expense from 304 to 311334. To the way. Probil- decreased which had its effect on Return on as well The capital Employed or Return on Eanity reund so the firm has no debe in tro impro interest payment is Nil. Overall efficiency from the business has to dreduce its en direct- expenses. The main draw back return against book of ROCE is that it measures o As the assets Value are depriciated the ROCE will increase though So to the roove of assets in the business. even the cash flow has remained the same. a chievements of a company a NP 4 loo) are not an This ROLE analysis often focuses on that happen in the short - tum, so it may not be good measure of more longer-term success ROLE company that it may experience. cannot be adjusted to account for different- risk factors from different investments company has made. The probitabili ty ration live, Net Probit margin (N. evergreen" ratio, that can be used to compare probitability amongst - Various industries. The expenses expenses, value of investments be easily manupulated to increase on decrease the probita bity ratios as far their needs which misleading for the Stakeholders. The ratios are dependent independent and depends on calculations as reported in the financial statements. A material or fraud en a line_item will result mis- calculated ratio which would result result the stakeholders and investors to face devastating conserience. can can be investors and nol- error in a Tan Feb Mar Gross Probil 190 190x1vo2 17:57 - X100= 43 754 450 242:22 xlvo Margin Call xD alo 480 400 Wer Profit 12.57 13 7 st Margin (Net Probit x100 10.88-1 Sales Bot 31 33.7. 35% d. of Expense to Revenue Return on capital Employed CROCE) 20.834 22 767 15.367 Profitability Ratios iy Margin Type > Probit as a % of Salex Product- Bittermuation y cost Leadership Gross krobit Margin indicates the production efficiency of the firm. Wet Probit Margin indicates the over all efficiency of the firm i.e. (Production & operating it Tax). & Intust From the results we can that the efficiency or reduce its we can see the gross forotit margin is gradually decreasing from January to March which clearly bolises that the firm's production en y is decreasing, so in order to erectity in the firm Thoned tours to increase its sakes. direct expenses which are related to production, on the other hand in case of Nela Profil W.P ncneased from Tan to Feb but in manch N. P again decreased. Forom on March the firm increased its in directa expense from 304 to 311334. To the way. Probil- decreased which had its effect on Return on as well The capital Employed or Return on Eanity reund so the firm has no debe in tro impro interest payment is Nil. Overall efficiency from the business has to dreduce its en direct- expenses. The main draw back return against book of ROCE is that it measures o As the assets Value are depriciated the ROCE will increase though So to the roove of assets in the business. even the cash flow has remained the same. a chievements of a company a NP 4 loo) are not an This ROLE analysis often focuses on that happen in the short - tum, so it may not be good measure of more longer-term success ROLE company that it may experience. cannot be adjusted to account for different- risk factors from different investments company has made. The probitabili ty ration live, Net Probit margin (N. evergreen" ratio, that can be used to compare probitability amongst - Various industries. The expenses expenses, value of investments be easily manupulated to increase on decrease the probita bity ratios as far their needs which misleading for the Stakeholders. The ratios are dependent independent and depends on calculations as reported in the financial statements. A material or fraud en a line_item will result mis- calculated ratio which would result result the stakeholders and investors to face devastating conserience. can can be investors and nol- error in a
Step by Step Solution
There are 3 Steps involved in it
Step: 1

Get Instant Access to Expert-Tailored Solutions
See step-by-step solutions with expert insights and AI powered tools for academic success
Step: 2

Step: 3

Ace Your Homework with AI
Get the answers you need in no time with our AI-driven, step-by-step assistance
Get Started


