

Question
Note: This is not a linear programming assignment it is a spreadsheet engineering assignment to give you a chance to practice basic principles of good
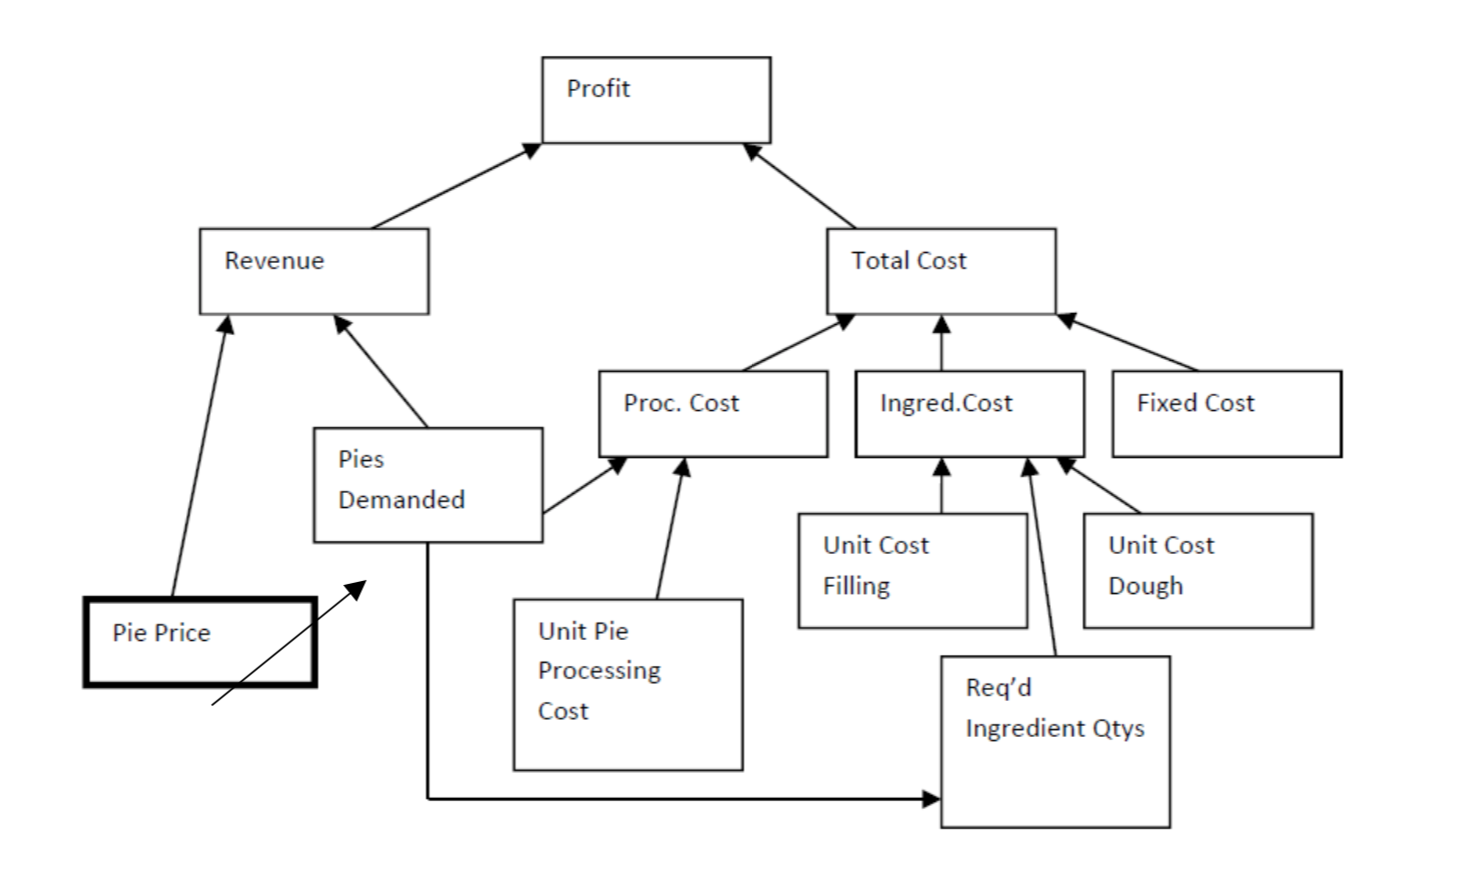
Note: This is not a linear programming assignment it is a spreadsheet engineering assignment to give you a chance to practice basic principles of good spreadsheet design. A startup company, Simon Pie company generates profit from combining two purchased ingredients (fruit and frozen dough) into apple pies, processing the pies (cooking packaging, delivery, etc.), and selling them to a local grocery store. The companys founder Samuel Simon intends to build an excel model to explore his options. Simons Initial Model Input Values Pie Price $8 Unit pie processing cost ($ per pie) $2.05 Unit cost, fruit filling ($ per pie) $3.48 Unit cost, dough ($ per pie) $0.30 Fixed cost ($000s per week) $12 After some reflection, Simon concludes that at a pie price of $12 there would be no demand for his pies and that below a $12 price he would gain an additional 4000 pies sold per week for each $1 reduction in price. So, for simplicity, he assumes that a demand relationship is expressed by a linear equation. Before implementing the model on the spreadsheet, an analyst colleague drew the following influence diagram to clarify the relationship between variables. Pie Price is the decision.
(on excel)
Profit Revenue Total Cost Proc. Cost Ingred.Cost Fixed Cost Pies Demanded Unit Cost Unit Cost Filling Dough Pie Price Unit Pie Processing Cost Req'd Ingredient Qtys Profit Revenue Total Cost Proc. Cost Ingred.Cost Fixed Cost Pies Demanded Unit Cost Unit Cost Filling Dough Pie Price Unit Pie Processing Cost Req'd Ingredient QtysStep by Step Solution
There are 3 Steps involved in it
Step: 1

Get Instant Access to Expert-Tailored Solutions
See step-by-step solutions with expert insights and AI powered tools for academic success
Step: 2

Step: 3
Ace Your Homework with AI
Get the answers you need in no time with our AI-driven, step-by-step assistance
Get Started
Larry Ellison Database Genius Of Oracle
Authors: Craig Peters
1st Edition
0766019748, 978-0766019744