

Answered step by step
Verified Expert Solution
Question
1 Approved Answer
Now, try changing the values of x and y from 2 and-3 to other constant values. Describe in your Word document how this changes the
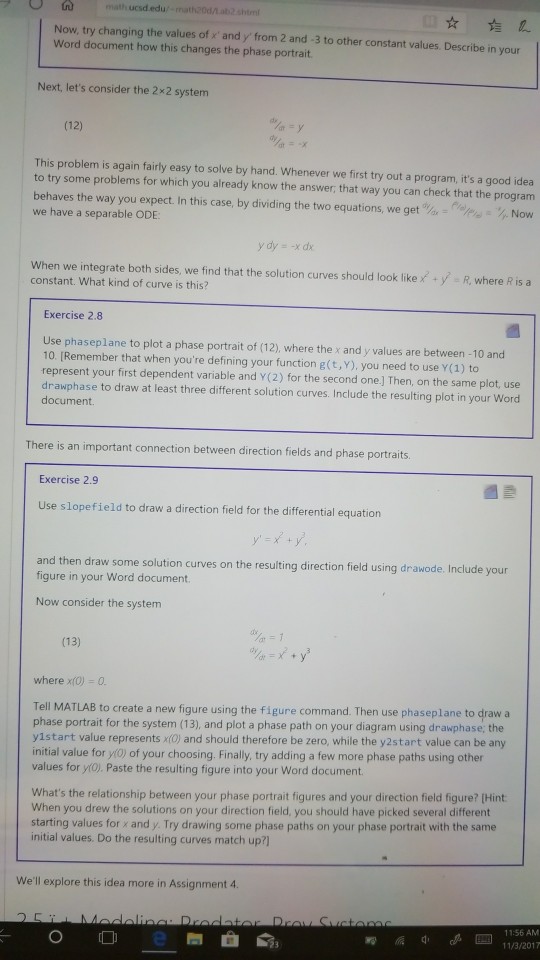
Now, try changing the values of x and y from 2 and-3 to other constant values. Describe in your Word document how this changes the phase portrait Next, let's consider the 2x2 system (12) This problem is again fairly easy to solve by hand. Whenever we first try out a program, it's a good idea to try some problems for which you already know the answer, that way you can check that the program behaves the way you expect. In this case, by dividing the two equations, we get elrNow we have a separable ODE When we integrate both sides, we find that the solution curves should look like constant. What kind of curve is this? y R, where R is a Exercise 2.8 Use phaseplane to plot a phase portrait of (12), where the x and y values are between -10 and 10. [Remember that when you're defining your function g(t, Y), you need to use Y(1) to represent your first dependent variable and Y(2) for the second one.] Then, on the same plot, use drawphase to draw at least three different solution curves. Include the resulting plot in your Word document. There is an important connection between direction fields and phase portraits Exercise 2.9 Use slopefield to draw a direction field for the differential equation and then draw some solution curves on the resulting direction field using drawode. Include figure in your Word document. Now consider the system (13) where x(0) 0 Tell MATLAB to create a new figure using the figure command. Then use phaseplane to draw a phase portrait for the system (13), and plot a phase path on your diagram using drawphase, the y1start value represents x(0) and should therefore be zero, while the y2start value can be any initial value for y0) of your choosing. Finally, try adding a few more phase paths using other values for yo) Paste the resulting figure into your Word document What's the relationship between your phase portrait figures and your direction field figure? (Hint When you drew the solutions on your direction field, you should have picked several different starting values for x and y. Try drawing some phase paths on your phase portrait with the same initial values. Do the resulting curves match up?] We'll explore this idea more in Assignment 4. 11:56 AM 11/3/2017 Now, try changing the values of x and y from 2 and-3 to other constant values. Describe in your Word document how this changes the phase portrait Next, let's consider the 2x2 system (12) This problem is again fairly easy to solve by hand. Whenever we first try out a program, it's a good idea to try some problems for which you already know the answer, that way you can check that the program behaves the way you expect. In this case, by dividing the two equations, we get elrNow we have a separable ODE When we integrate both sides, we find that the solution curves should look like constant. What kind of curve is this? y R, where R is a Exercise 2.8 Use phaseplane to plot a phase portrait of (12), where the x and y values are between -10 and 10. [Remember that when you're defining your function g(t, Y), you need to use Y(1) to represent your first dependent variable and Y(2) for the second one.] Then, on the same plot, use drawphase to draw at least three different solution curves. Include the resulting plot in your Word document. There is an important connection between direction fields and phase portraits Exercise 2.9 Use slopefield to draw a direction field for the differential equation and then draw some solution curves on the resulting direction field using drawode. Include figure in your Word document. Now consider the system (13) where x(0) 0 Tell MATLAB to create a new figure using the figure command. Then use phaseplane to draw a phase portrait for the system (13), and plot a phase path on your diagram using drawphase, the y1start value represents x(0) and should therefore be zero, while the y2start value can be any initial value for y0) of your choosing. Finally, try adding a few more phase paths using other values for yo) Paste the resulting figure into your Word document What's the relationship between your phase portrait figures and your direction field figure? (Hint When you drew the solutions on your direction field, you should have picked several different starting values for x and y. Try drawing some phase paths on your phase portrait with the same initial values. Do the resulting curves match up?] We'll explore this idea more in Assignment 4. 11:56 AM 11/3/2017
Step by Step Solution
There are 3 Steps involved in it
Step: 1

Get Instant Access to Expert-Tailored Solutions
See step-by-step solutions with expert insights and AI powered tools for academic success
Step: 2

Step: 3
Ace Your Homework with AI
Get the answers you need in no time with our AI-driven, step-by-step assistance
Get Started
Professional Visual Basic 6 Databases
Authors: Charles Williams
1st Edition
1861002025, 978-1861002020