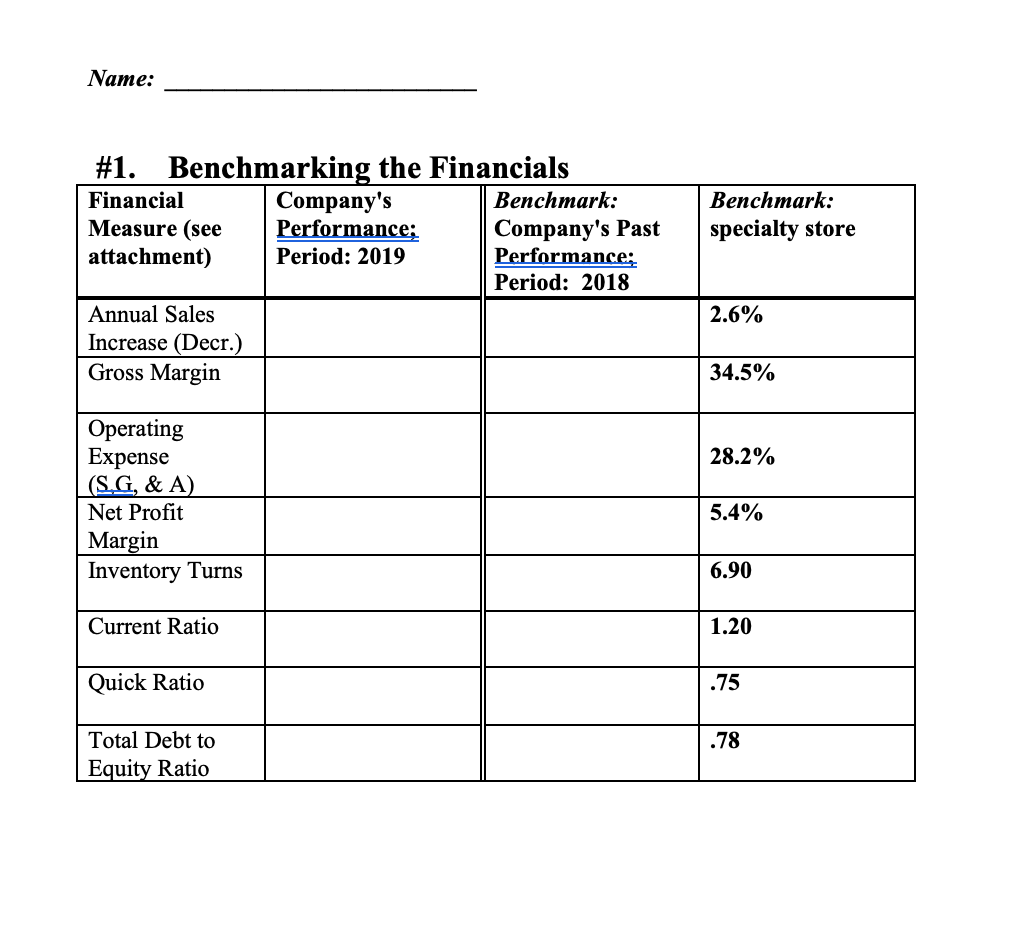
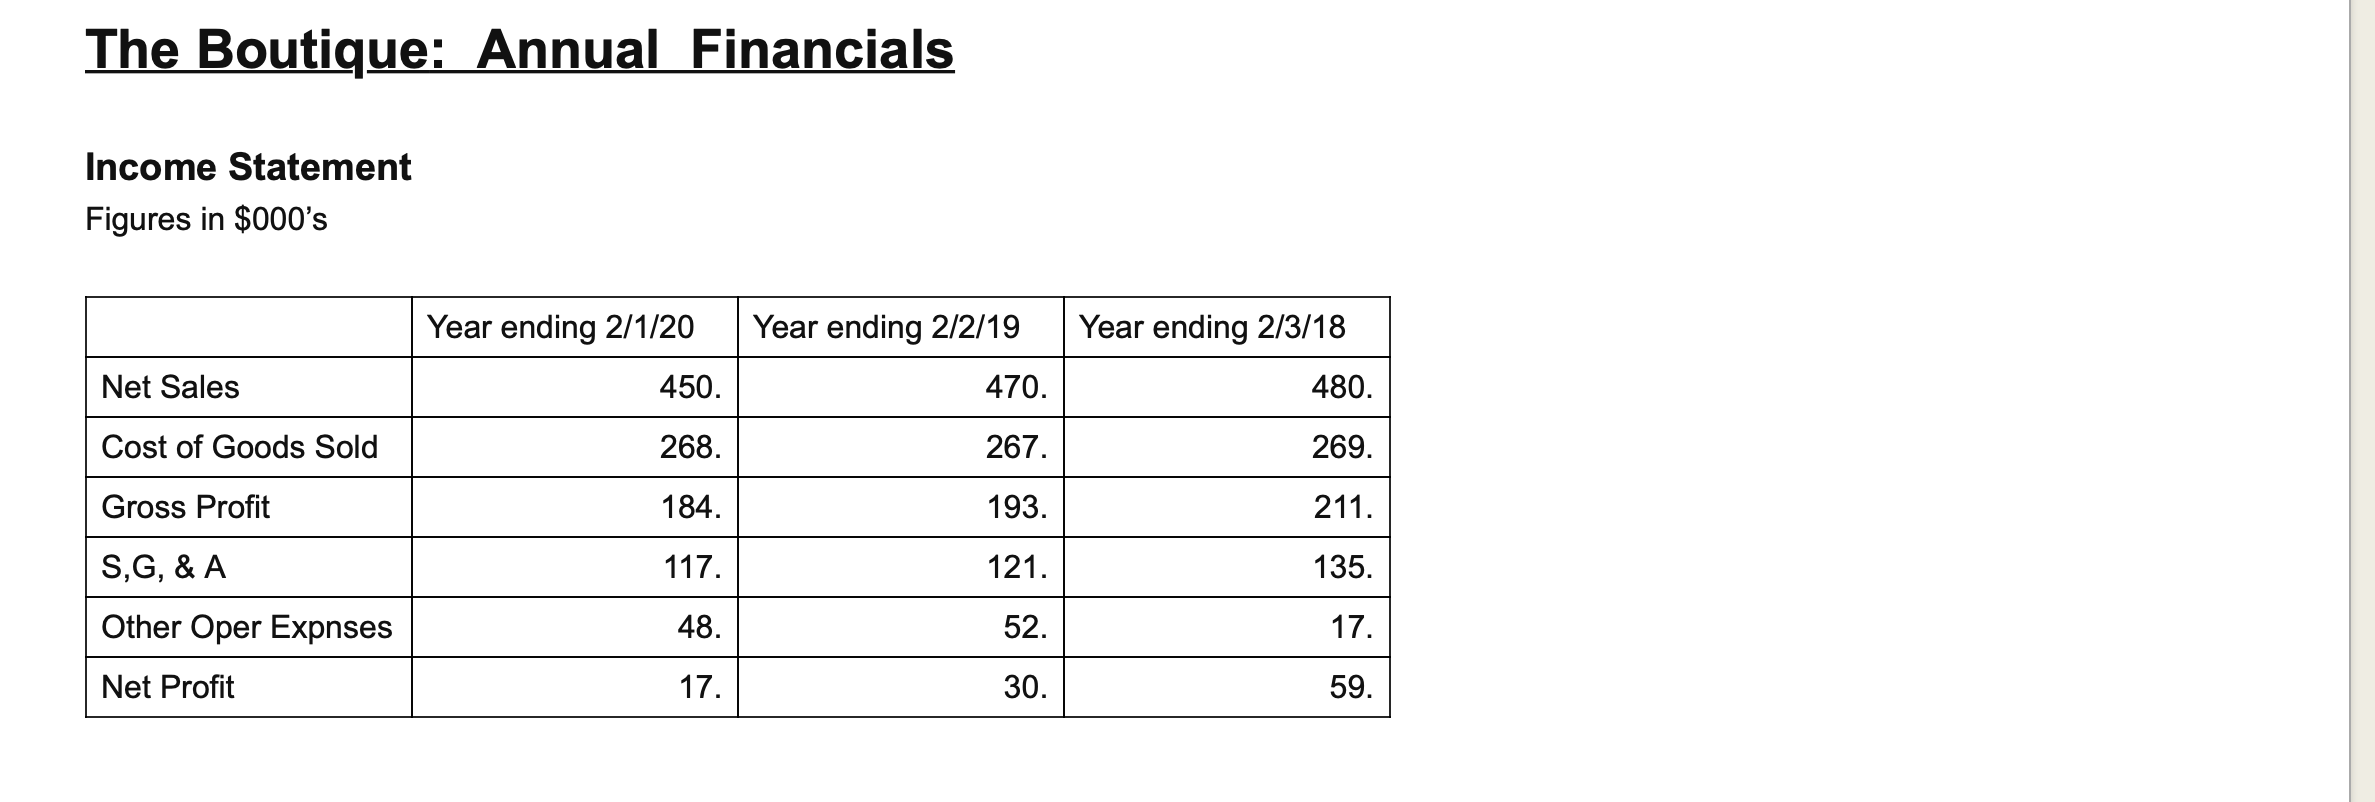
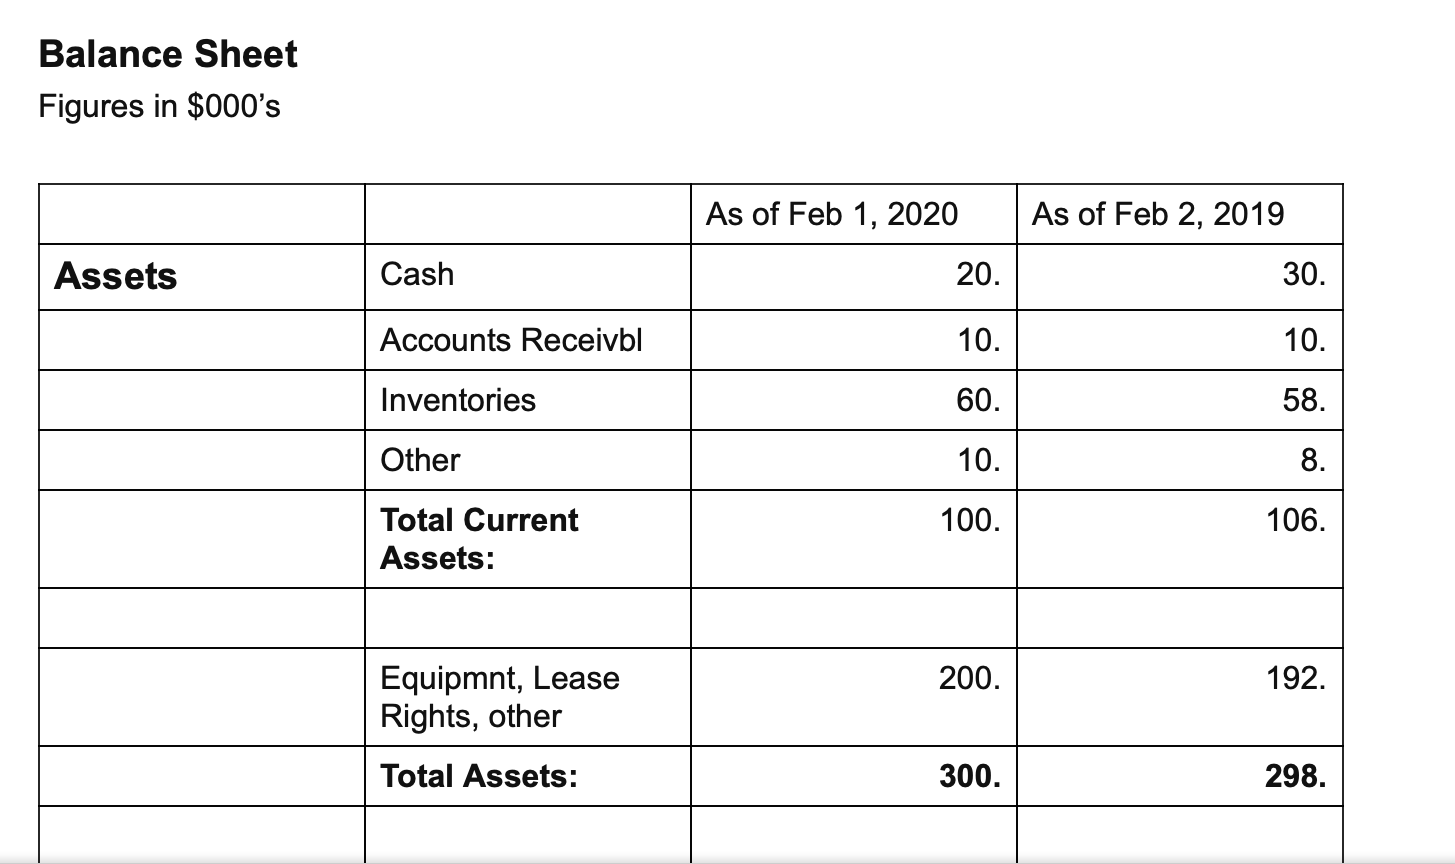
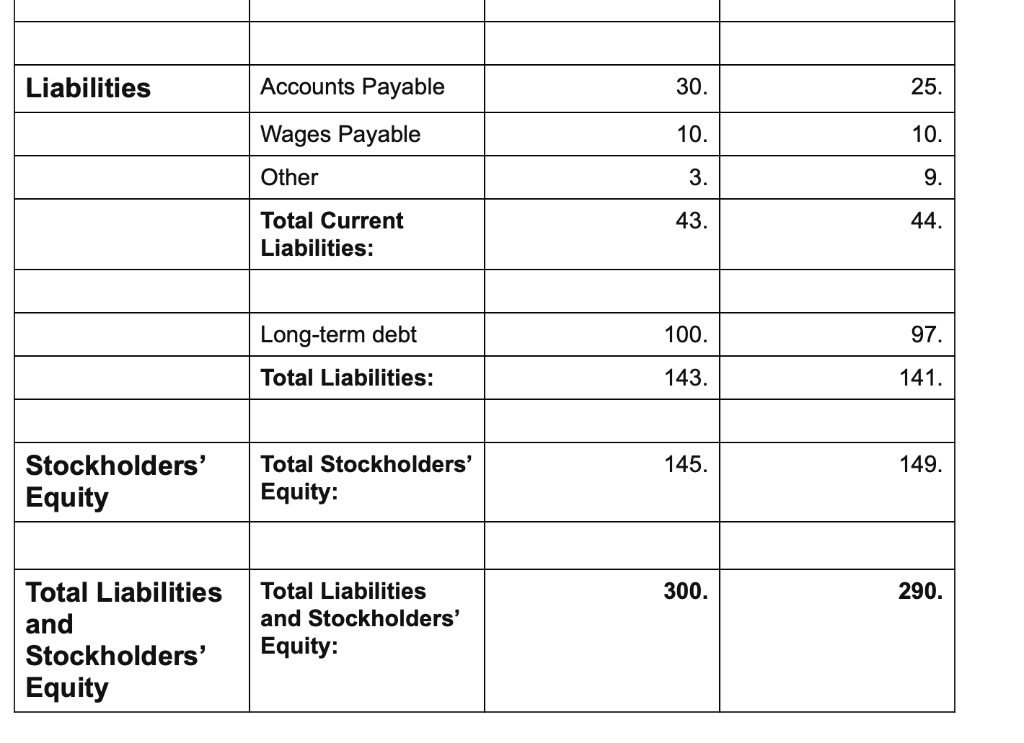
 Numbers are in thousands. Please help me with filling out the financials.
Name: Benchmark: specialty store #1. Benchmarking the Financials Financial Company's Benchmark: Measure (see Performance; Company's Past attachment) Period: 2019 Performance; Period: 2018 Annual Sales Increase (Decr.) Gross Margin 2.6% 34.5% 28.2% Operating Expense (S.G, & A) Net Profit Margin Inventory Turns 5.4% 6.90 Current Ratio 1.20 Quick Ratio .75 .78 Total Debt to Equity Ratio The Boutique: Annual Financials Income Statement Figures in $000's Year ending 2/1/20 Year ending 2/2/19 Year ending 2/3/18 Net Sales 450. 470. 480. Cost of Goods Sold 268. 267. 269. Gross Profit 184. 193. 211. S,G, & A 117. 121. 135. Other Oper Expnses 48. 52. 17. Net Profit 17. 30. 59. Balance Sheet Figures in $000's As of Feb 1, 2020 As of Feb 2, 2019 Assets Cash 20. 30. Accounts Receivbl 10. 10. Inventories 60. 58. Other 10. 8. 100. 106. Total Current Assets: 200. 192. Equipmnt, Lease Rights, other Total Assets: 300. 298. Liabilities Accounts Payable 30. 25. Wages Payable 10. 10. Other 3. 9. 43. 44. Total Current Liabilities: Long-term debt 100. 97. Total Liabilities: 143. 141. 145. 149. Stockholders' Equity Total Stockholders' Equity: 300. 290. Total Liabilities and Stockholders' Equity Total Liabilities and Stockholders' Equity: Name: Benchmark: specialty store #1. Benchmarking the Financials Financial Company's Benchmark: Measure (see Performance; Company's Past attachment) Period: 2019 Performance; Period: 2018 Annual Sales Increase (Decr.) Gross Margin 2.6% 34.5% 28.2% Operating Expense (S.G, & A) Net Profit Margin Inventory Turns 5.4% 6.90 Current Ratio 1.20 Quick Ratio .75 .78 Total Debt to Equity Ratio The Boutique: Annual Financials Income Statement Figures in $000's Year ending 2/1/20 Year ending 2/2/19 Year ending 2/3/18 Net Sales 450. 470. 480. Cost of Goods Sold 268. 267. 269. Gross Profit 184. 193. 211. S,G, & A 117. 121. 135. Other Oper Expnses 48. 52. 17. Net Profit 17. 30. 59. Balance Sheet Figures in $000's As of Feb 1, 2020 As of Feb 2, 2019 Assets Cash 20. 30. Accounts Receivbl 10. 10. Inventories 60. 58. Other 10. 8. 100. 106. Total Current Assets: 200. 192. Equipmnt, Lease Rights, other Total Assets: 300. 298. Liabilities Accounts Payable 30. 25. Wages Payable 10. 10. Other 3. 9. 43. 44. Total Current Liabilities: Long-term debt 100. 97. Total Liabilities: 143. 141. 145. 149. Stockholders' Equity Total Stockholders' Equity: 300. 290. Total Liabilities and Stockholders' Equity Total Liabilities and Stockholders' Equity


 Numbers are in thousands. Please help me with filling out the financials.


