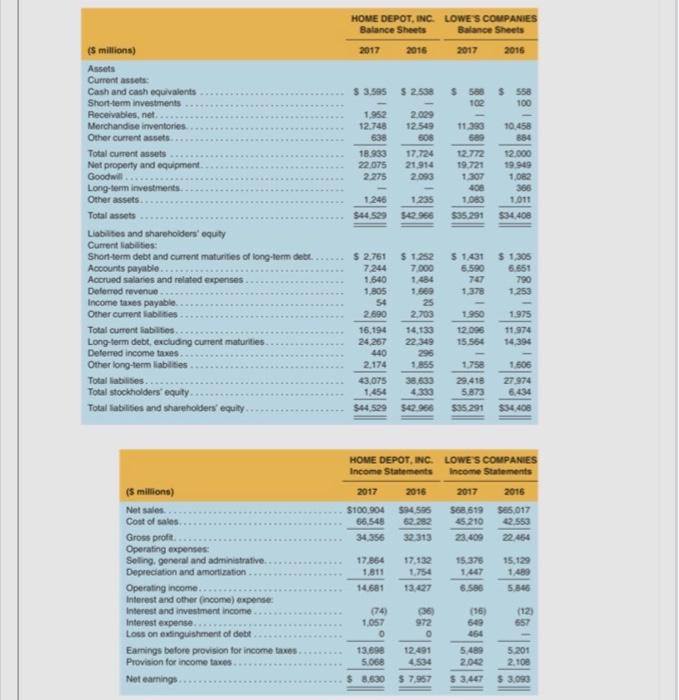
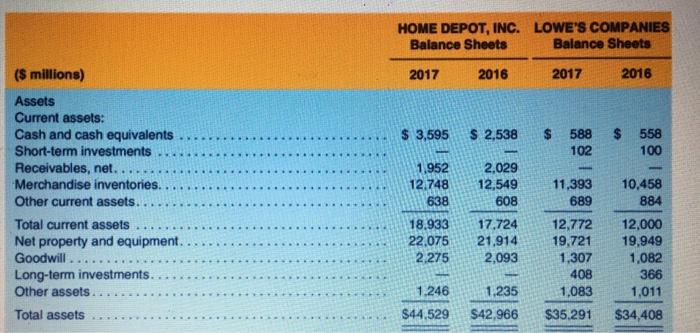
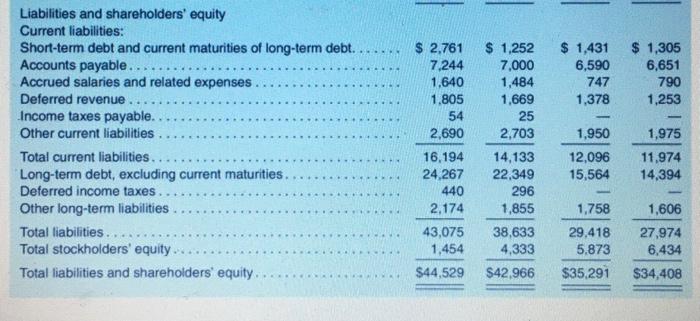
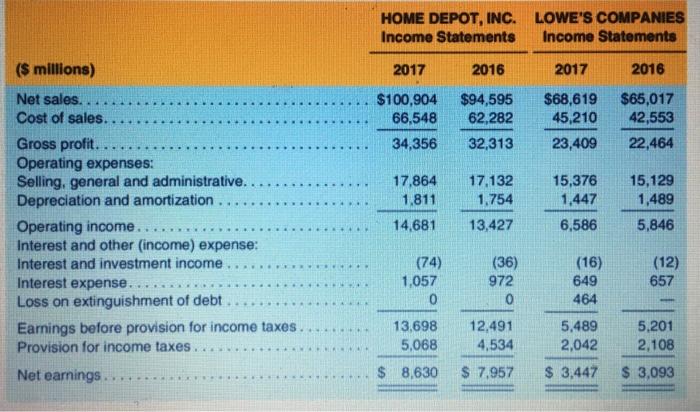
Balance sheets and income statements for The Home Depot Inc and Lowes Companies Inc follow. Refer to these financial statements to answer the requirements. HOME DEPOT, INCLOWES COMPANIES Balance Sheets Balance Sheets 2017 2016 2017 2015 $ 3.595 $ 2538 $ 588 $ 558 102 100 1.952 12.748 638 18.933 22.075 2.275 2.029 12.549 508 17.724 21.914 2.093 11.390 580 12.772 19721 1.307 400 1,083 $35291 10.458 884 12.000 19.949 1,082 1.246 $44 529 1235 $42.966 1.011 $34.400 (5 millions Assets Current assets Cash and cash equivalents Short-term investments Receivables, net. Merchandise inventories Other current assets Total current assets Net property and equipment Goodwill Long-term investments Other assets Total assets Liabilities and shareholders' equity Current abaties: Short-term debt and current maturities of long-term debt. Accounts payable.. Accrued salaries and related expenses Deferred revenue Income taxes payable Other current abilities Total current liabilities Long-term debt, excluding current maturities Deferred income taxes Other long-term liabilities Total abilities. Total stockholders' equity Total abilities and shareholders' equity $ 2,761 7244 1.640 1.805 5 1/431 6.590 $ 1,305 6.651 790 1.250 $ 1.252 7.000 1.484 5.569 25 2.703 14.130 22.349 295 1.855 1950 12.095 15.554 2.690 16.194 24.267 440 2.174 43,075 1.454 $44.529 1975 11.974 14.394 1.506 27.974 38.633 4.330 1.750 29.418 5.873 $35.291 $34.408 HOME DEPOT, INCLOWES COMPANIES Income Statements Income Statements 2017 2016 2017 2016 $100.904 56.548 34 356 594595 62.282 32.313 568 619 45.210 23.409 S85.017 42 553 22.454 17,132 15.375 15.129 (5 million) Net sales Cost of sales Gross profit Operating expenses Seling general and administrative Depreciation and amortization Operating income. Interest and other income) expenses Interest and investment income Interest expense Loss on extinguishment of debt Earnings before provision for income taxes Provision for income taxes Net earnings 17.854 1.811 14681 6.580 5.846 36 972 557 1.057 0 13.690 5.068 $ 8,630 12.491 4534 $ 7,957 (16) 549 464 5.489 2.042 $ 3.447 5.201 2.100 $ 3.OSO REQUIRED a. Compute return on equity (ROE), retum on assets (ROA), and return on financial leverage (ROFL.) for each company in fiscal year 2017. Assume a tax rate of 35% for these years. b. Disaggregate the ROA's computed into profit margin (PM) and asset turnover (AT) compo nents. Which of these factors drives ROA for each company? c Compute the gross profit margin (GPM) and operating expense-to-sales ratios for each com- pany. How do these companies' profitability measures compare? d. Compute the accounts receivable tumover (ART), inventory turnover (INVT), and property, plant, and equipment turnover (PPET) for each company. How do these companies' turnover measures compare? e. Compare and evaluate these competitors' performance in 2017. HOME DEPOT, INC. LOWE'S COMPANIES Balance Sheets Balance Sheets 2017 2016 2017 2016 $ 3,595 $ 2,538 $ $ 588 102 558 100 ($ millions) Assets Current assets: Cash and cash equivalents Short-term investments Receivables, net.. Merchandise inventories. Other current assets. Total current assets Net property and equipment. Goodwill Long-term investments Other assets Total assets 1,952 12.748 638 18.933 22.075 2,275 2.029 12,549 608 17.724 21.914 2,093 11,393 689 12,772 19,721 1,307 408 1,083 $35.291 10.458 884 12,000 19.949 1,082 366 1,011 $34,408 1.246 $44.529 1.235 $42.966 $ 1,431 6,590 747 1,378 $ 1,305 6,651 790 1,253 Liabilities and shareholders' equity Current liabilities: Short-term debt and current maturities of long-term debt. Accounts payable. Accrued salaries and related expenses Deferred revenue. Income taxes payable. Other current liabilities Total current liabilities... Long-term debt, excluding current maturities. Deferred income taxes. Other long-term liabilities Total liabilities... Total stockholders' equity Total liabilities and shareholders' equity $ 2,761 7,244 1,640 1.805 54 2,690 16,194 24,267 440 2,174 43,075 1,454 $44,529 $ 1,252 7,000 1,484 1,669 25 2,703 14,133 22,349 296 1,855 38,633 4,333 $42.966 1,950 12,096 15,564 1,975 11,974 14,394 1,758 1,606 29.418 5.873 27,974 6,434 $34,408 $35,291 HOME DEPOT, INC. LOWE'S COMPANIES Income Statements Income Statements 2017 2016 2017 2016 $100,904 66,548 34,356 $94,595 62,282 32,313 $68,619 45,210 23,409 $65,017 42,553 22,464 . . 17,864 1,811 14,681 17.132 1,754 15,376 1,447 ($ millions) Net sales... Cost of sales. Gross profit. Operating expenses: Selling, general and administrative.. Depreciation and amortization Operating income. Interest and other (income) expense: Interest and investment income. Interest expense.... Loss on extinguishment of debt. Earnings before provision for income taxes. Provision for income taxes. 15,129 1,489 13,427 ++ 6,586 5,846 ++. (74) 1.057 0 (36) 972 0 (16) 649 464 (12) 657 .. 13,698 5,068 12.491 4.534 5,489 2,042 5,201 2,108 Net earnings $ 8,630 $ 7,957 $ 3,447 $ 3,093 HOME DEPOT, INCLOWES COMPANIES Balance Sheets Balance Sheets 2017 2016 2017 2015 $ 3.595 $ 2538 $ 588 $ 558 102 100 1.952 12.748 638 18.933 22.075 2.275 2.029 12.549 508 17.724 21.914 2.093 11.390 580 12.772 19721 1.307 400 1,083 $35291 10.458 884 12.000 19.949 1,082 1.246 $44 529 1235 $42.966 1.011 $34.400 (5 millions Assets Current assets Cash and cash equivalents Short-term investments Receivables, net. Merchandise inventories Other current assets Total current assets Net property and equipment Goodwill Long-term investments Other assets Total assets Liabilities and shareholders' equity Current abaties: Short-term debt and current maturities of long-term debt. Accounts payable.. Accrued salaries and related expenses Deferred revenue Income taxes payable Other current abilities Total current liabilities Long-term debt, excluding current maturities Deferred income taxes Other long-term liabilities Total abilities. Total stockholders' equity Total abilities and shareholders' equity $ 2,761 7244 1.640 1.805 5 1/431 6.590 $ 1,305 6.651 790 1.250 $ 1.252 7.000 1.484 5.569 25 2.703 14.130 22.349 295 1.855 1950 12.095 15.554 2.690 16.194 24.267 440 2.174 43,075 1.454 $44.529 1975 11.974 14.394 1.506 27.974 38.633 4.330 1.750 29.418 5.873 $35.291 $34.408 HOME DEPOT, INCLOWES COMPANIES Income Statements Income Statements 2017 2016 2017 2016 $100.904 56.548 34 356 594595 62.282 32.313 568 619 45.210 23.409 S85.017 42 553 22.454 17,132 15.375 15.129 (5 million) Net sales Cost of sales Gross profit Operating expenses Seling general and administrative Depreciation and amortization Operating income. Interest and other income) expenses Interest and investment income Interest expense Loss on extinguishment of debt Earnings before provision for income taxes Provision for income taxes Net earnings 17.854 1.811 14681 6.580 5.846 36 972 557 1.057 0 13.690 5.068 $ 8,630 12.491 4534 $ 7,957 (16) 549 464 5.489 2.042 $ 3.447 5.201 2.100 $ 3.OSO REQUIRED a. Compute return on equity (ROE), retum on assets (ROA), and return on financial leverage (ROFL.) for each company in fiscal year 2017. Assume a tax rate of 35% for these years. b. Disaggregate the ROA's computed into profit margin (PM) and asset turnover (AT) compo nents. Which of these factors drives ROA for each company? c Compute the gross profit margin (GPM) and operating expense-to-sales ratios for each com- pany. How do these companies' profitability measures compare? d. Compute the accounts receivable tumover (ART), inventory turnover (INVT), and property, plant, and equipment turnover (PPET) for each company. How do these companies' turnover measures compare? e. Compare and evaluate these competitors' performance in 2017. HOME DEPOT, INC. LOWE'S COMPANIES Balance Sheets Balance Sheets 2017 2016 2017 2016 $ 3,595 $ 2,538 $ $ 588 102 558 100 ($ millions) Assets Current assets: Cash and cash equivalents Short-term investments Receivables, net.. Merchandise inventories. Other current assets. Total current assets Net property and equipment. Goodwill Long-term investments Other assets Total assets 1,952 12.748 638 18.933 22.075 2,275 2.029 12,549 608 17.724 21.914 2,093 11,393 689 12,772 19,721 1,307 408 1,083 $35.291 10.458 884 12,000 19.949 1,082 366 1,011 $34,408 1.246 $44.529 1.235 $42.966 $ 1,431 6,590 747 1,378 $ 1,305 6,651 790 1,253 Liabilities and shareholders' equity Current liabilities: Short-term debt and current maturities of long-term debt. Accounts payable. Accrued salaries and related expenses Deferred revenue. Income taxes payable. Other current liabilities Total current liabilities... Long-term debt, excluding current maturities. Deferred income taxes. Other long-term liabilities Total liabilities... Total stockholders' equity Total liabilities and shareholders' equity $ 2,761 7,244 1,640 1.805 54 2,690 16,194 24,267 440 2,174 43,075 1,454 $44,529 $ 1,252 7,000 1,484 1,669 25 2,703 14,133 22,349 296 1,855 38,633 4,333 $42.966 1,950 12,096 15,564 1,975 11,974 14,394 1,758 1,606 29.418 5.873 27,974 6,434 $34,408 $35,291 HOME DEPOT, INC. LOWE'S COMPANIES Income Statements Income Statements 2017 2016 2017 2016 $100,904 66,548 34,356 $94,595 62,282 32,313 $68,619 45,210 23,409 $65,017 42,553 22,464 . . 17,864 1,811 14,681 17.132 1,754 15,376 1,447 ($ millions) Net sales... Cost of sales. Gross profit. Operating expenses: Selling, general and administrative.. Depreciation and amortization Operating income. Interest and other (income) expense: Interest and investment income. Interest expense.... Loss on extinguishment of debt. Earnings before provision for income taxes. Provision for income taxes. 15,129 1,489 13,427 ++ 6,586 5,846 ++. (74) 1.057 0 (36) 972 0 (16) 649 464 (12) 657 .. 13,698 5,068 12.491 4.534 5,489 2,042 5,201 2,108 Net earnings $ 8,630 $ 7,957 $ 3,447 $ 3,093


