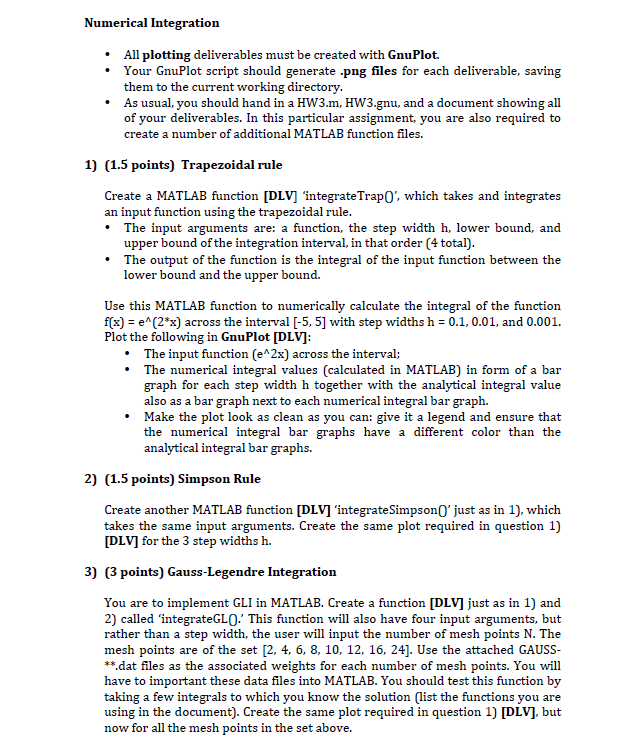
Numerical Integration All plotting deliverables must be created with GnuPlot. Your GnuPlot script should generate .png files for each deliverable, saving them to the current working directory. As usual, you should hand in a HW3.m, HW3.gnu, and a document showing all of your deliverables. In this particular assignment, you are also required to create a number of additional MATLAB function files. 1) (1.5 points) Trapezoidal rule Create a MATLAB function [DLV] 'integrate TrapO', which takes and integrates an input function using the trapezoidal rule. The input arguments are: a function, the step width h, lower bound, and upper bound of the integration interval, in that order (4 total). The output of the function is the integral of the input function between the lower bound and the upper bound. Use this MATLAB function to numerically calculate the integral of the function f(x) = e(2*x) across the interval [-5, 5] with step widths h = 0.1, 0.01, and 0.001. Plot the following in GnuPlot [DLV]: The input function (e^2x) across the interval; The numerical integral values (calculated in MATLAB) in form of a bar graph for each step width h together with the analytical integral value also as a bar graph next to each numerical integral bar graph. Make the plot look as clean as you can: give it a legend and ensure that the numerical integral bar graphs have a different color than the analytical integral bar graphs. 2) (1.5 points) Simpson Rule Create another MATLAB function [DLV] 'integrate Simpson('just as in 1), which takes the same input arguments. Create the same plot required in question 1) [DLV] for the 3 step widths h. 3) (3 points) Gauss-Legendre Integration You are to implement GLI in MATLAB. Create a function [DLV] just as in 1) and 2) called 'integrateGLO. This function will also have four input arguments, but rather than a step width, the user will input the number of mesh points N. The mesh points are of the set [2, 4, 6, 8, 10, 12, 16, 24). Use the attached GAUSS- *.dat files as the associated weights for each number of mesh points. You will have to important these data files into MATLAB. You should test this function by taking a few integrals to which you know the solution (list the functions you are using in the document). Create the same plot required in question 1) [DLV), but now for all the mesh points in the set above. Numerical Integration All plotting deliverables must be created with GnuPlot. Your GnuPlot script should generate .png files for each deliverable, saving them to the current working directory. As usual, you should hand in a HW3.m, HW3.gnu, and a document showing all of your deliverables. In this particular assignment, you are also required to create a number of additional MATLAB function files. 1) (1.5 points) Trapezoidal rule Create a MATLAB function [DLV] 'integrate TrapO', which takes and integrates an input function using the trapezoidal rule. The input arguments are: a function, the step width h, lower bound, and upper bound of the integration interval, in that order (4 total). The output of the function is the integral of the input function between the lower bound and the upper bound. Use this MATLAB function to numerically calculate the integral of the function f(x) = e(2*x) across the interval [-5, 5] with step widths h = 0.1, 0.01, and 0.001. Plot the following in GnuPlot [DLV]: The input function (e^2x) across the interval; The numerical integral values (calculated in MATLAB) in form of a bar graph for each step width h together with the analytical integral value also as a bar graph next to each numerical integral bar graph. Make the plot look as clean as you can: give it a legend and ensure that the numerical integral bar graphs have a different color than the analytical integral bar graphs. 2) (1.5 points) Simpson Rule Create another MATLAB function [DLV] 'integrate Simpson('just as in 1), which takes the same input arguments. Create the same plot required in question 1) [DLV] for the 3 step widths h. 3) (3 points) Gauss-Legendre Integration You are to implement GLI in MATLAB. Create a function [DLV] just as in 1) and 2) called 'integrateGLO. This function will also have four input arguments, but rather than a step width, the user will input the number of mesh points N. The mesh points are of the set [2, 4, 6, 8, 10, 12, 16, 24). Use the attached GAUSS- *.dat files as the associated weights for each number of mesh points. You will have to important these data files into MATLAB. You should test this function by taking a few integrals to which you know the solution (list the functions you are using in the document). Create the same plot required in question 1) [DLV), but now for all the mesh points in the set above


