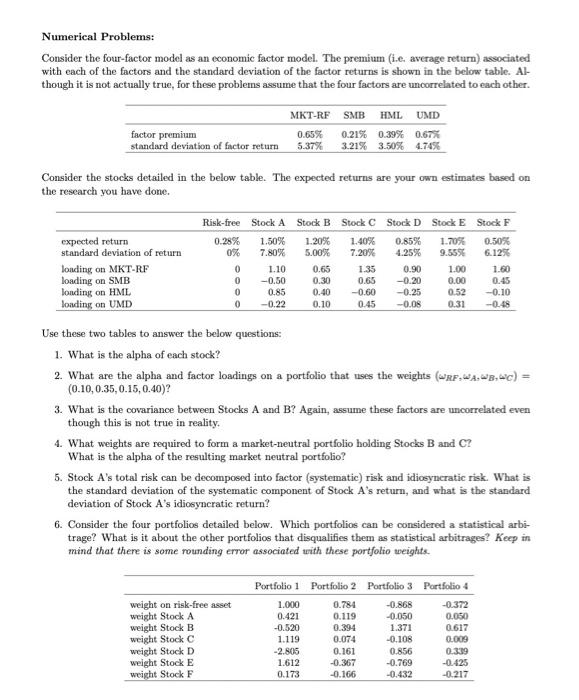
Numerical Problems: Consider the four-factor model as an economic factor model. The premium (i.e. average return) associated with each of the factors and the standard deviation of the factor returns is shown in the below table. Al- though it is not actually true, for these problems assume that the four factors are uncorrelated to each other. factor premium standard deviation of factor return MKT-RF SMB HML UMD 0.65% 0.21% 0.39% 0.67% 5.37% 3.21% 3.50% 4.74% Consider the stocks detailed in the below table. The expected returns are your own estimates based on the research you have done. expected return standard deviation of return loading on MKT-RF loading on SMB londing on HML loading on UMD Risk-free Stock A Stock B Stock C Stock D Stock E Stock F 0.28% 1.50% 1.20% 1.40% 0.85% 1.70% 0.50% 0% 7.80% 5.00% 7.20% 4.25% 9.555 6.125 0 1.10 0.65 135 0.90 1.00 1.60 0 -0.50 0.30 0.65 -0.20 0.00 0.45 0 0.85 0.40 -0.60 -0.25 0.52 -0.10 0 -0.22 0.10 0.45 -0.08 0.31 -0.48 Use these two tables to answer the below questions: 1. What is the alpha of each stock? 2. What are the alpha and factor loadings on a portfolio that uses the weights (RF. 4A,3,40) = (0.10.0.35, 0.15,0.40)? 3. What is the covariance between Stocks A and B? Again, assume these factors are un correlated even though this is not true in reality. 4. What weights are required to form a market-neutral portfolio holding Stocks B and C? What is the alpha of the resulting market neutral portfolio? 5. Stock A's total risk can be decomposed into factor (systematic) risk and idiosyncratic risk. What is the standard deviation of the systematic component of Stock A's return, and what is the standard deviation of Stock A's idiosyncratic return? 6. Consider the four portfolios detailed below. Which portfolios can be considered a statistical arbi- trage? What is it about the other portfolios that disqualifies them as statistical arbitrages? Keep in mind that there is some rounding error associated with these portfolio weights. weight on risk-free asset weight Stock A weight Stock B weight Stock C weight Stock D weight Stock E weight Stock F Portfolio 1 Portfolio 2 Portfolio 3 Portfolio 4 1.000 0.784 -0.868 -0.372 0.421 0.119 -0.050 0.050 -0.520 0.394 1.371 0.617 1.119 0.074 -0.108 0.009 -2.805 0.161 0.856 0.339 1.612 -0.367 -0.769 -0.425 0.173 -0.166 -0.432 -0.217 Numerical Problems: Consider the four-factor model as an economic factor model. The premium (i.e. average return) associated with each of the factors and the standard deviation of the factor returns is shown in the below table. Al- though it is not actually true, for these problems assume that the four factors are uncorrelated to each other. factor premium standard deviation of factor return MKT-RF SMB HML UMD 0.65% 0.21% 0.39% 0.67% 5.37% 3.21% 3.50% 4.74% Consider the stocks detailed in the below table. The expected returns are your own estimates based on the research you have done. expected return standard deviation of return loading on MKT-RF loading on SMB londing on HML loading on UMD Risk-free Stock A Stock B Stock C Stock D Stock E Stock F 0.28% 1.50% 1.20% 1.40% 0.85% 1.70% 0.50% 0% 7.80% 5.00% 7.20% 4.25% 9.555 6.125 0 1.10 0.65 135 0.90 1.00 1.60 0 -0.50 0.30 0.65 -0.20 0.00 0.45 0 0.85 0.40 -0.60 -0.25 0.52 -0.10 0 -0.22 0.10 0.45 -0.08 0.31 -0.48 Use these two tables to answer the below questions: 1. What is the alpha of each stock? 2. What are the alpha and factor loadings on a portfolio that uses the weights (RF. 4A,3,40) = (0.10.0.35, 0.15,0.40)? 3. What is the covariance between Stocks A and B? Again, assume these factors are un correlated even though this is not true in reality. 4. What weights are required to form a market-neutral portfolio holding Stocks B and C? What is the alpha of the resulting market neutral portfolio? 5. Stock A's total risk can be decomposed into factor (systematic) risk and idiosyncratic risk. What is the standard deviation of the systematic component of Stock A's return, and what is the standard deviation of Stock A's idiosyncratic return? 6. Consider the four portfolios detailed below. Which portfolios can be considered a statistical arbi- trage? What is it about the other portfolios that disqualifies them as statistical arbitrages? Keep in mind that there is some rounding error associated with these portfolio weights. weight on risk-free asset weight Stock A weight Stock B weight Stock C weight Stock D weight Stock E weight Stock F Portfolio 1 Portfolio 2 Portfolio 3 Portfolio 4 1.000 0.784 -0.868 -0.372 0.421 0.119 -0.050 0.050 -0.520 0.394 1.371 0.617 1.119 0.074 -0.108 0.009 -2.805 0.161 0.856 0.339 1.612 -0.367 -0.769 -0.425 0.173 -0.166 -0.432 -0.217