

Question: Objective: Demonstrate the Central Limit Theorem (CLT) through simulation and random sampling. Background: If a random variable X follows a discrete uniform distribution between a
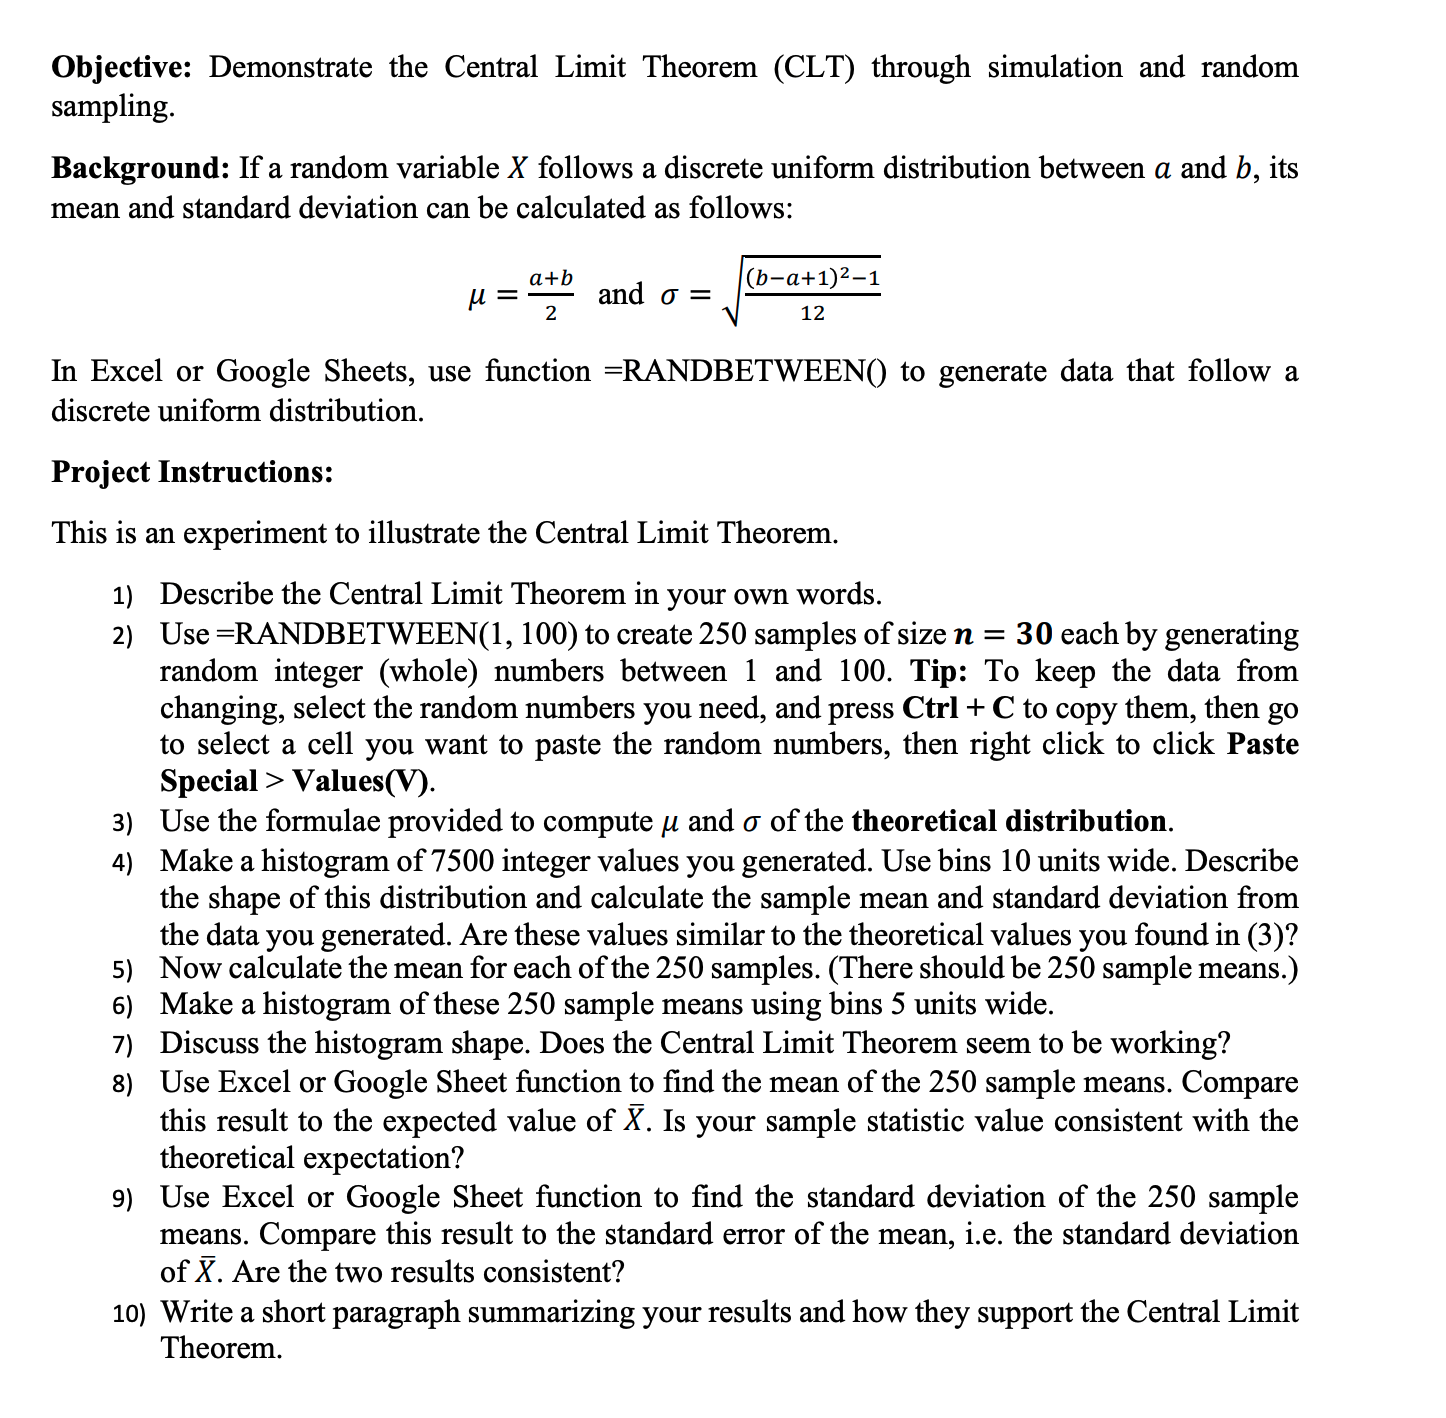
Objective: Demonstrate the Central Limit Theorem (CLT) through simulation and random sampling. Background: If a random variable X follows a discrete uniform distribution between a and 1), its mean and standard deviation can be calculated as follows: a+b ba+1 21 ,u = and a = 2 12 In Excel or Google Sheets, use function =RANDBETWEENO to generate data that follow a discrete uniform distribution. Project Instructions: This is an experiment to illustrate the Central Limit Theorem. 1) Describe the Central Limit Theorem in your own words. 2) Use =RANDBETWEEN(1, 100) to create 250 samples of size n = 30 each by generating random integer (whole) numbers between 1 and 100. Tip: To keep the data from changing, select the random numbers you need, and press Ctrl + C to copy them, then go to select a cell you want to paste the random numbers, then right click to click Paste Special > Values(V). 3) Use the formulae provided to compute a and a of the theoretical distribution. 4) Make a histogram of 7500 integer values you generated. Use bins 10 units wide. Describe the shape of this distribution and calculate the sample mean and standard deviation from the data you generated. Are these values similar to the theoretical values you found in (3)? 5) Now calculate the mean for each of the 250 samples. (There should be 250 sample means.) 6) Make a histogram of these 250 sample means using bins 5 units wide. 7) Discuss the histogram shape. Does the Central Limit Theorem seem to be working? 8) Use Excel or Google Sheet function to nd the mean of the 250 sample means. Compare this result to the expected value of )7. Is your sample statistic value consistent with the theoretical expectation? 9) Use Excel or Google Sheet function to nd the standard deviation of the 250 sample means. Compare this result to the standard error of the mean, i.e. the standard deviation of If. Are the two results consistent? 10) Write a short paragraph summarizing your results and how they support the Central Limit Theorem
Step by Step Solution
There are 3 Steps involved in it

Get step-by-step solutions from verified subject matter experts