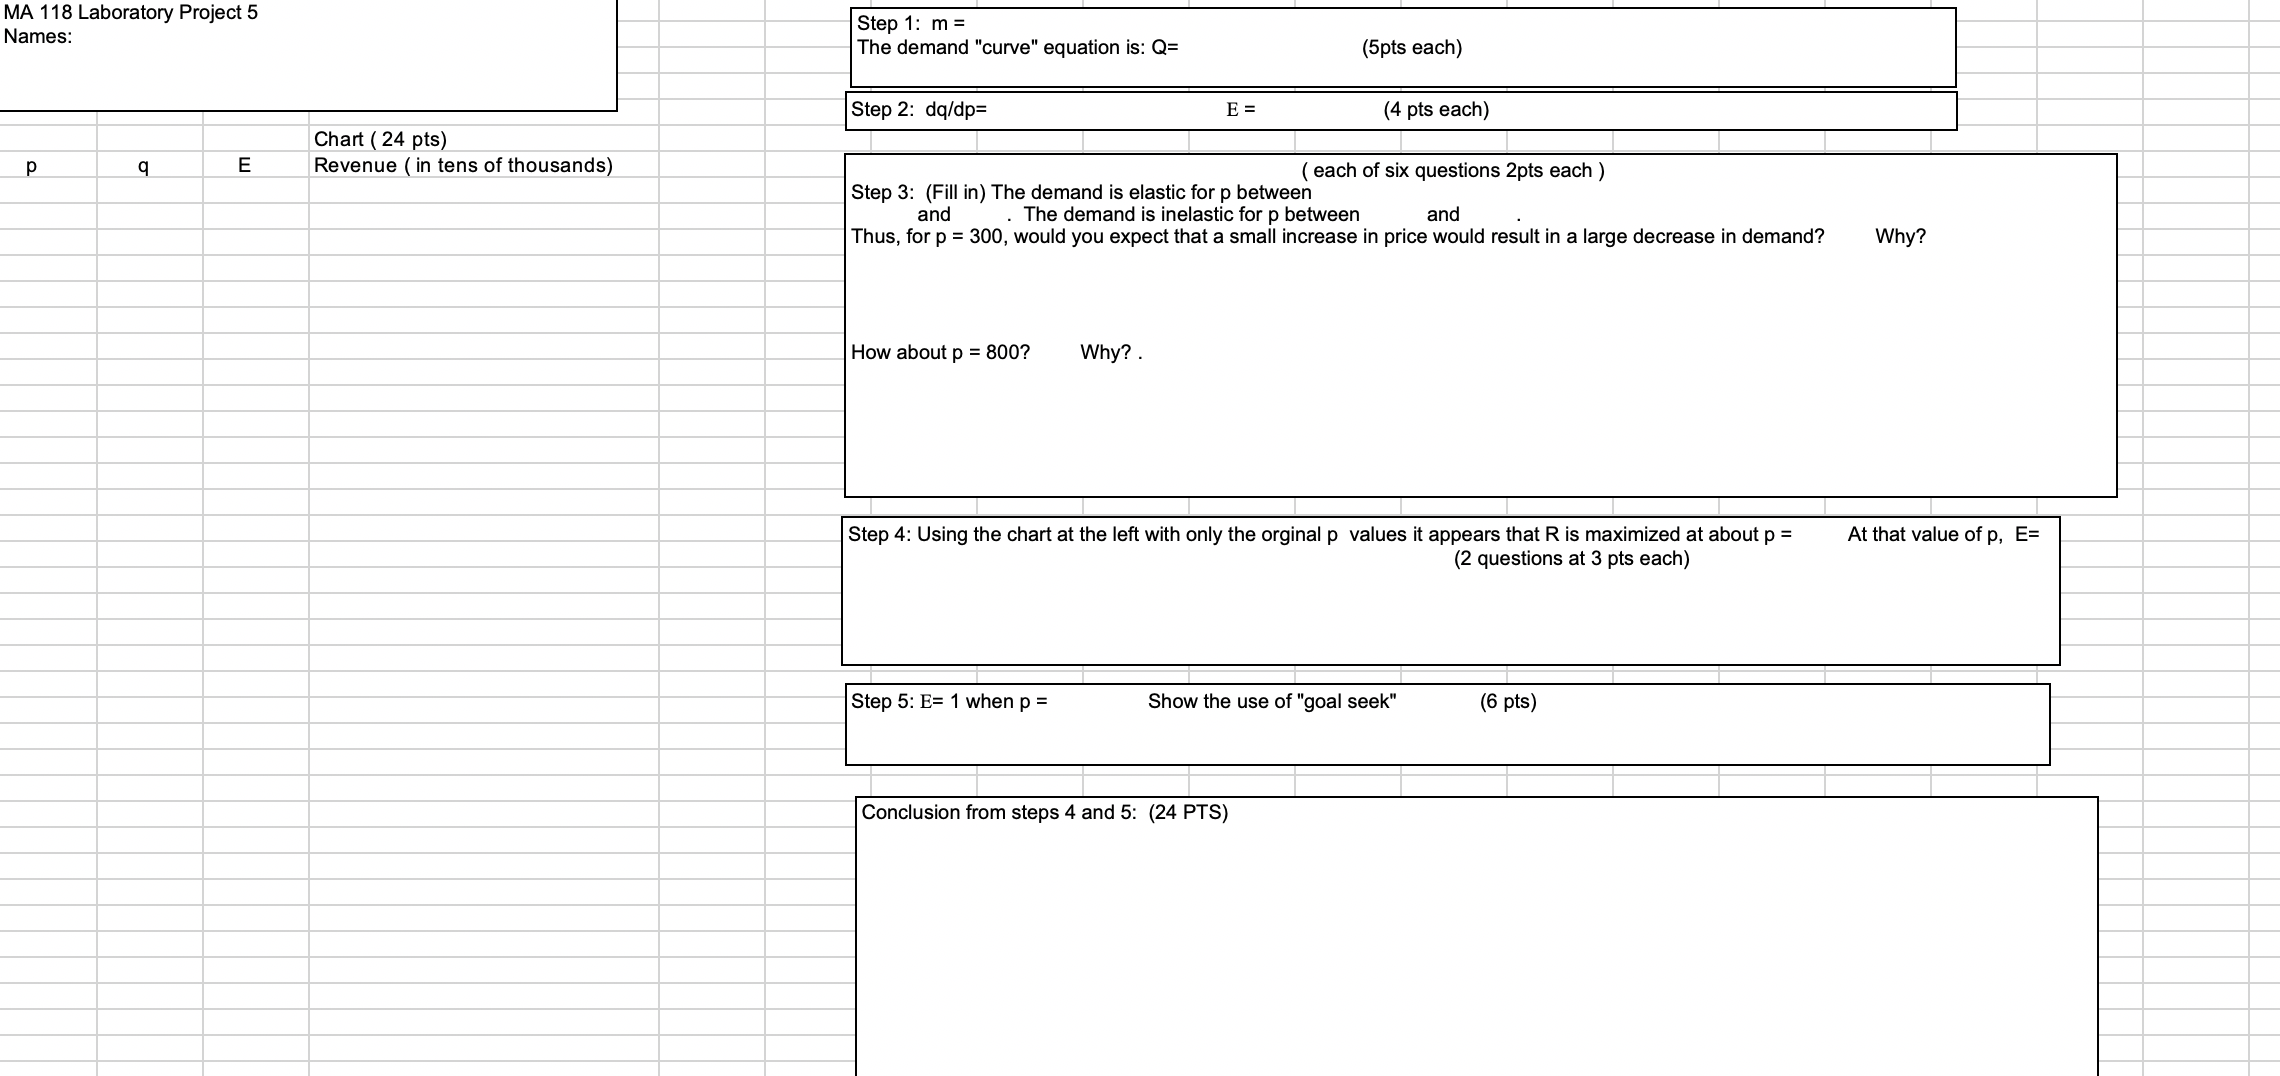
Objective: To use the concept of elasticity of demand to determine an appropriate tuition level for the University. Problem Description: This is a continuation of Math 117 laboratory exercise # 2. In that exercise, you were required to develop supply and demand curves from sample data and to calculate the market equilibrium point. The data consisted of two data points each for the supply and demand curves. The data were credit hours and cost per credit hour. In this exercise, we'll modify the demand data slightly and use the data points: 62,000 credits hours will be demanded (registered for by students) when the tuition cost is $900 per credit hour and 122,000 credit hours will be demanded when the tuition cost is $400 per credit hour. You are to use the concepts of elasticity to assist in selecting the tuition rate that will ensure the best possible total revenue. When possible for elasticity type problems, it is convenient to express quanity as a function of price. Recall: The formula for elasticity is given by E = - (p!q)(dqldp). Step 1. Enter your data on the next sheet under p and q. However, dontjust put them in rows 5 and 6; rather, pick a reasonable range of values for p (obviously they must include the Mo prices listed above, but should go somewhat beyond them) and put your two values for q at the appropriate places in the table. Then, use the data points given above to develop the expression that represents demand (number of credit hours) as a linear function of price. Recall: the equation of a line is of the form y = mx+b (where m is the slope and b is the y-intercept). In our case, the y-ivariable is q and the x- variable is p. Fill in the rest of the values for q using your formula, and make sure it agrees with the two vaiues you're given before going on! Step 2. Find the derivative of quantity with resprect to price and use it to nd the formula for the elasticity for demand, E. Step 3. In column C. ll in the values for E and graph the coefcient of elasticity over your range of the price variable.Using your chart, determine the intervals of p where the demand is elastic and inelastic. Step 4. Develop (in column D) and graph the Total Revenue function, R. (Recall: R = qp.) Express the revenue in tens of thousaands. From the graph, estimate the costicredit hour that will maximize the Total Revenue. Find the elasticity at that value of p. Step 5. Find the costlcredit hour gure that produces a unity coefcient of elasticity. That is, use GoalSeek to find the value of p for which E = 1. As your conclusion, make a guess as to the relationship between the value of the coefcient of elasticity for a demand function and a value of price that maximizes the Total Revenue. MA 118 laboratory Project 5 Names: l l l l l l l l l Step1: m = The demand 'curve' equation is: Q= (5pts each) Step 2: dqldp= E = (4 pts each) Chan ( 24 ms) l l l l l l p q E Revenue ( In tens of thousands) ( each of six questions Zp's each ) Step 3: (Fill in) The demand is elastic for p between and . The demand is inelastic for p between and Thus, for p = 300. would you expect that a small increase in price would result in a large decrease in demand? Haw about p = 8007 Why? . Why? Step 4: Using the chart at the left with only the orginal p values it appears that R is maximized at about p = (2 questions at 3 pm each) At that value at p, E= l l l l l l Conclusion from steps 4 and 5: (24 PTS) \f