Answered step by step
Verified Expert Solution
Question
1 Approved Answer
Obtain the statement of cash flows for General Mills Inc. (ticker symbol GIS) for the period ending on May 31, 2020 from Yahoo! Finance, and


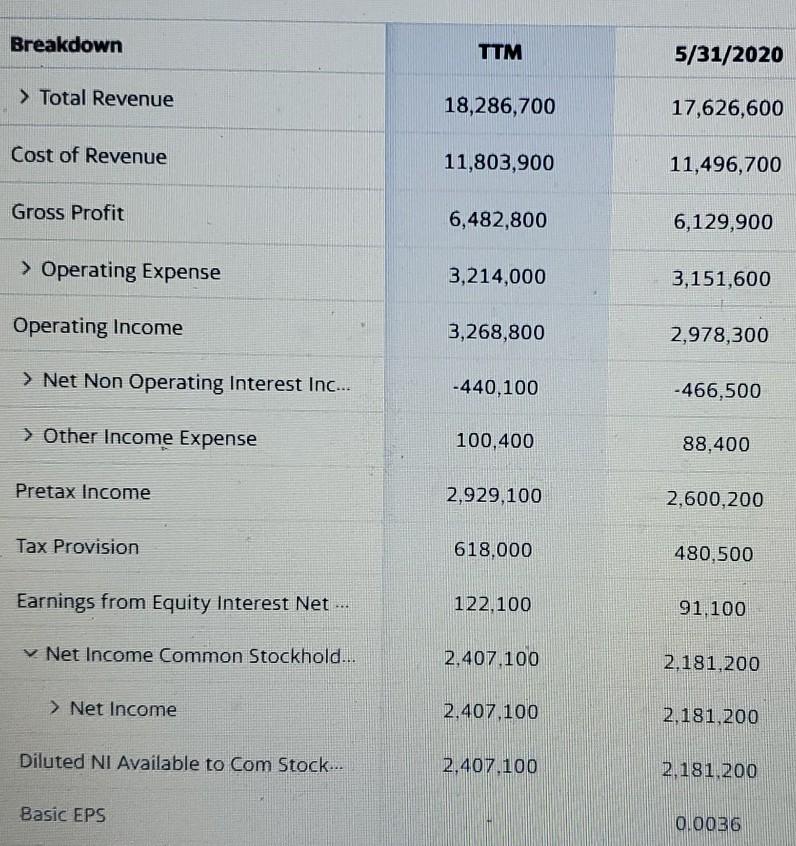
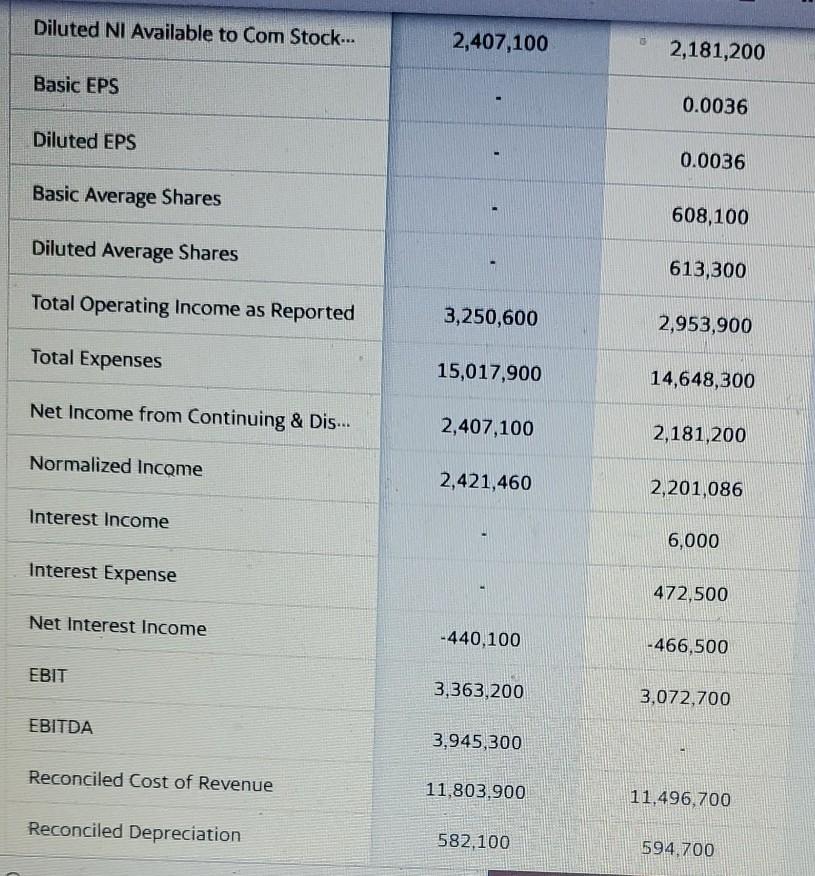
Obtain the statement of cash flows for General Mills Inc. (ticker symbol GIS) for the period ending on May 31, 2020 from Yahoo! Finance, and provide the following amounts for General Mills Inc.: a. Net income b. Depreciation c. Cash flow from operating activities d. Cash flow from investing activities e. Cash flow from financing activities f. Change in cash and cash equivalents a. The net income for General Mills Inc. is $ million. (Round to one decimal place.) Breakdown TTM 5/31/2020 > Total Revenue 18,286,700 17,626,600 Cost of Revenue 11,803,900 11,496,700 Gross Profit 6,482,800 6,129,900 > Operating Expense 3,214,000 3,151,600 Operating Income 3,268,800 2,978,300 > Net Non Operating Interest Inc... -440,100 -466,500 > Other Income Expense 100,400 88,400 Pretax Income 2,929,100 2,600,200 Tax Provision 618,000 480,500 Earnings from Equity Interest Net ... 122,100 91.100 Net Income Common Stockhold... 2.407.100 2,181,200 > Net Income 2.407,100 2,181,200 Diluted NI Available to Com Stock... 2.407.100 2.181.200 Basic EPS 0.0036 Diluted NI Available to Com Stock... 2,407,100 2,181,200 Basic EPS 0.0036 Diluted EPS 0.0036 Basic Average Shares 608,100 Diluted Average Shares 613,300 Total Operating Income as Reported 3,250,600 2,953,900 Total Expenses 15,017,900 14,648,300 Net Income from Continuing & Dis... 2,407,100 2,181,200 Normalized Income 2,421,460 2,201,086 Interest Income 6,000 Interest Expense 472,500 Net Interest Income -440,100 -466,500 EBIT 3,363,200 3,072,700 EBITDA 3,945,300 Reconciled Cost of Revenue 11,803.900 11,496,700 Reconciled Depreciation 582,100 594,700 Obtain the statement of cash flows for General Mills Inc. (ticker symbol GIS) for the period ending on May 31, 2020 from Yahoo! Finance, and provide the following amounts for General Mills Inc.: a. Net income b. Depreciation c. Cash flow from operating activities d. Cash flow from investing activities e. Cash flow from financing activities f. Change in cash and cash equivalents a. The net income for General Mills Inc. is $ million. (Round to one decimal place.) Breakdown TTM 5/31/2020 > Total Revenue 18,286,700 17,626,600 Cost of Revenue 11,803,900 11,496,700 Gross Profit 6,482,800 6,129,900 > Operating Expense 3,214,000 3,151,600 Operating Income 3,268,800 2,978,300 > Net Non Operating Interest Inc... -440,100 -466,500 > Other Income Expense 100,400 88,400 Pretax Income 2,929,100 2,600,200 Tax Provision 618,000 480,500 Earnings from Equity Interest Net ... 122,100 91.100 Net Income Common Stockhold... 2.407.100 2,181,200 > Net Income 2.407,100 2,181,200 Diluted NI Available to Com Stock... 2.407.100 2.181.200 Basic EPS 0.0036 Diluted NI Available to Com Stock... 2,407,100 2,181,200 Basic EPS 0.0036 Diluted EPS 0.0036 Basic Average Shares 608,100 Diluted Average Shares 613,300 Total Operating Income as Reported 3,250,600 2,953,900 Total Expenses 15,017,900 14,648,300 Net Income from Continuing & Dis... 2,407,100 2,181,200 Normalized Income 2,421,460 2,201,086 Interest Income 6,000 Interest Expense 472,500 Net Interest Income -440,100 -466,500 EBIT 3,363,200 3,072,700 EBITDA 3,945,300 Reconciled Cost of Revenue 11,803.900 11,496,700 Reconciled Depreciation 582,100 594,700
Step by Step Solution
There are 3 Steps involved in it
Step: 1

Get Instant Access to Expert-Tailored Solutions
See step-by-step solutions with expert insights and AI powered tools for academic success
Step: 2

Step: 3

Ace Your Homework with AI
Get the answers you need in no time with our AI-driven, step-by-step assistance
Get Started


