Answered step by step
Verified Expert Solution
Question
1 Approved Answer
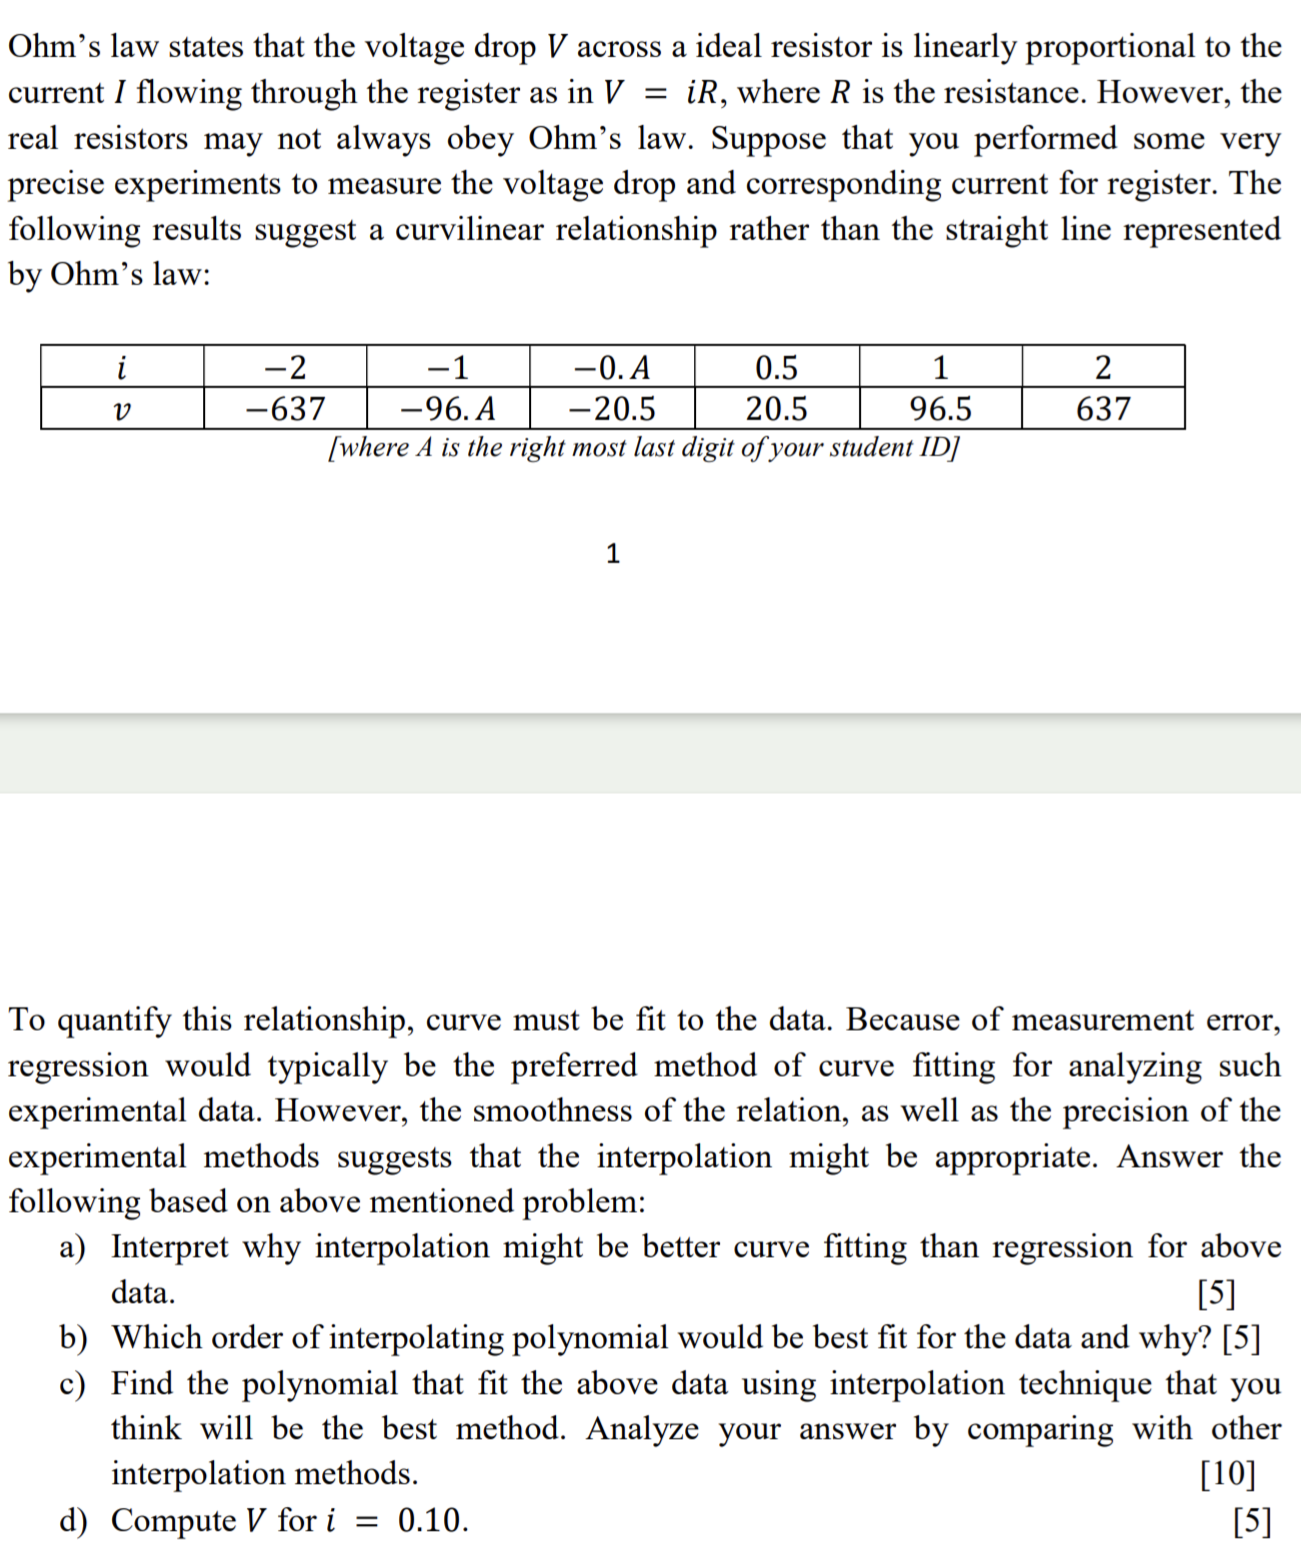
Ohm's law states that the voltage drop V across a ideal resistor is linearly proportional to the current I flowing through the register as in
Ohm's law states that the voltage drop across a ideal resistor is linearly proportional to the
current I flowing through the register as in where is the resistance. However, the
real resistors may not always obey Ohm's law. Suppose that you performed some very
precise experiments to measure the voltage drop and corresponding current for register. The
following results suggest a curvilinear relationship rather than the straight line represented
by Ohm's law:
where A is the right most last digit of your student ID
To quantify this relationship, curve must be fit to the data. Because of measurement error,
regression would typically be the preferred method of curve fitting for analyzing such
experimental data. However, the smoothness of the relation, as well as the precision of the
experimental methods suggests that the interpolation might be appropriate. Answer the
following based on above mentioned problem:
a Interpret why interpolation might be better curve fitting than regression for above
data.
b Which order of interpolating polynomial would be best fit for the data and why?
c Find the polynomial that fit the above data using interpolation technique that you
think will be the best method. Analyze your answer by comparing with other
interpolation methods.
d Compute for Ohm's law states that the voltage drop V across an ideal resistor is linearly proportional to the current i flowing through the resister as in Vi R where R is the resistance. However, real resistors may not always obey Ohm's law. Suppose that you performed some very precise experiments to measure the voltage drop and corresponding current for a resistor. The following results suggest a curvilinear relationship rather than the straight line represented by Ohm's law: To quantify this relationship, a curve must be fit to the data. Because of measurement error, regression would typically be the preferred method of curve fitting for analyzing such experimental data. However, the smoothness of the relationship, as well as the precision of the experimental methods, suggests that interpolation might be appropriate. Use a fifthorder interpolating polynomial to fit the given data. Round the final answer to two decimal places. The interpolating polynomial V

Step by Step Solution
There are 3 Steps involved in it
Step: 1

Get Instant Access to Expert-Tailored Solutions
See step-by-step solutions with expert insights and AI powered tools for academic success
Step: 2

Step: 3

Ace Your Homework with AI
Get the answers you need in no time with our AI-driven, step-by-step assistance
Get Started


