

Question
Ok. I must be loosing my mind. I have to Calculate and interpret the net present value (NPV) of the companies annual free cash flow
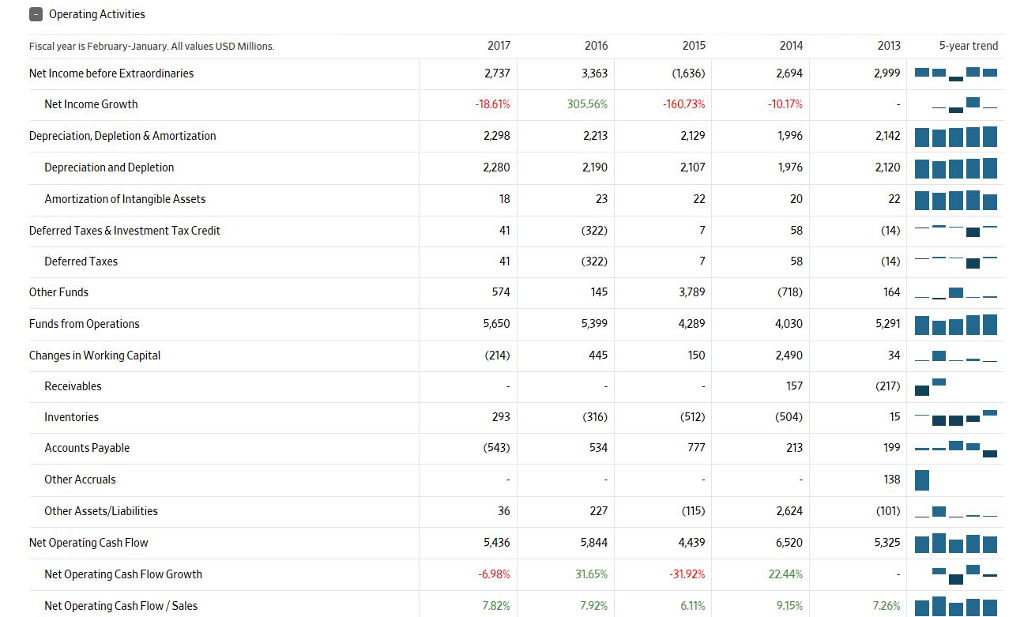
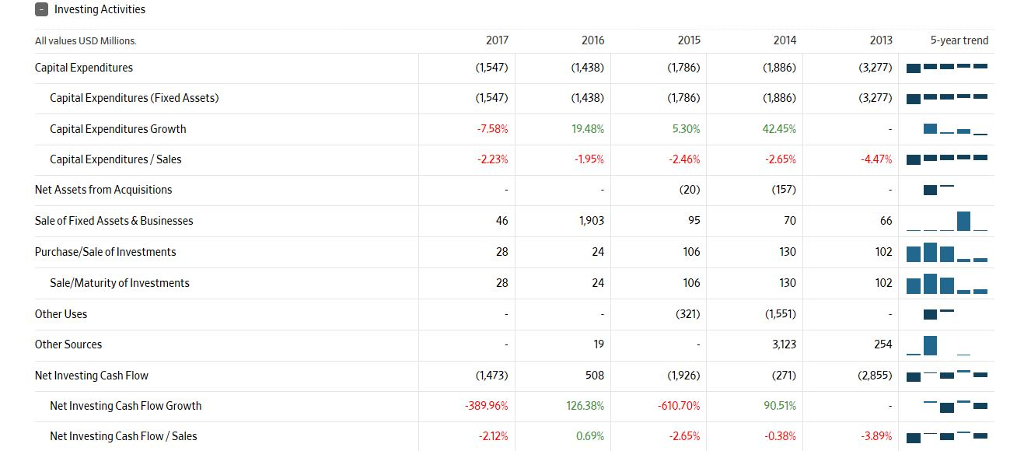
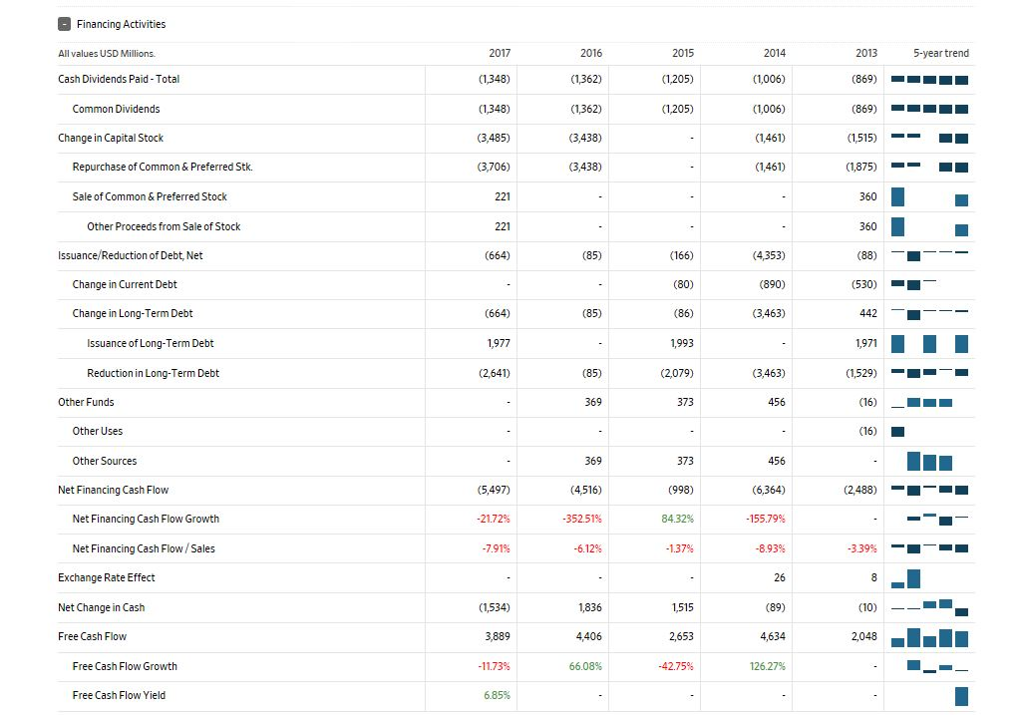 Ok. I must be loosing my mind. I have to Calculate and interpret the net present value (NPV) of the companies annual free cash flow (FCF) for a 5 year period (nper) taking into account a constant growth rate (which will need to be calculated), and a discount rate that is equal to your companies weighted average cost of capital (WACC), which is 7%. This is for the purpose of looking to acquire a company and to determine its valuation at Present Value. In this case, I am looking at Target. I have attached Target's financial statement of Cash Flow.
The Professor says, "For NPV, you are converting the companys future expected net cash inflows and outflows to their present value for the purpose of valuation the acquisition purchase. You are not considering the past cash flows".
I do I begin to start predicting future cash flows based on Target's the statement of Cash Flow?
How do I calculate the constant growth rate?
How do I set up a table in excel that will give me an NPV for future cash flows for a period of 5 years.
****I cannot attach the excel file containing TGT's financial data. However, I used Wall Street Journal financial data for Target and pulled up their financial cash flow statement***
It won't let me attach an excel file. What financial data do you need and I will get a picture of it?
O Operating Activities Fiscal year is February-January. All values USD Millions. 2017 2016 2015 2014 2013 Net Income before Extraordinaries 2,737 3,363 (1,636 2,694 7,999 Net Income Growth -18.61 305.56% -160.73 -10.17 Depreciation, Depletion & Amortization 2,298 2,213 2129 1,996 2,142 Depreciation and Depletion 2,2B0 2,190 2,107 1,976 2,120 Amortization of Intangible Assets 18 22 Deferred Taxes & Investment Tax Credit 1 (322) 58 (14 Deferred Taxes > 41 (372) (14 Other Funds 574 145 3,7B9 718 764 Funds from Operations * 5,650 5,399 4,289 4,030 5,291 Changes in Working Capital (214 445 150 2,490 34 Receivables 157 (217 Inventories 293 (316) (512) (504) Accounts Payable (543 534 777 213 199 Other Accruals 138 Other Assets/Liabilities 227 (115 2,624 (101) Net Operating Cash Flow 5,436 5,844 4,439 6,520 5,325 Net Operating Cash Flow Growth -6.98 37.65% -31.92 22.449 5325 11 -E- 7.26 TE Net Operating Cash Flow / Sales 7.82 792% 6.11 3.159 7.26Step by Step Solution
There are 3 Steps involved in it
Step: 1

Get Instant Access to Expert-Tailored Solutions
See step-by-step solutions with expert insights and AI powered tools for academic success
Step: 2

Step: 3
Ace Your Homework with AI
Get the answers you need in no time with our AI-driven, step-by-step assistance
Get Started
Advanced Level Audit And Assurance Q And A 2020
Authors: ACA Simplified
1st Edition
B08924C516, 979-8648590489