Answered step by step
Verified Expert Solution
Question
1 Approved Answer
Old MathJax webview According to the pic, try to give possible questions and answers related to enterpreneurial finance Main topic is about Amazon. Try to
Old MathJax webview


According to the pic, try to give possible questions and answers related to enterpreneurial finance
Main topic is about Amazon. Try to give possible questions with answers related to enterpreneurial finance.

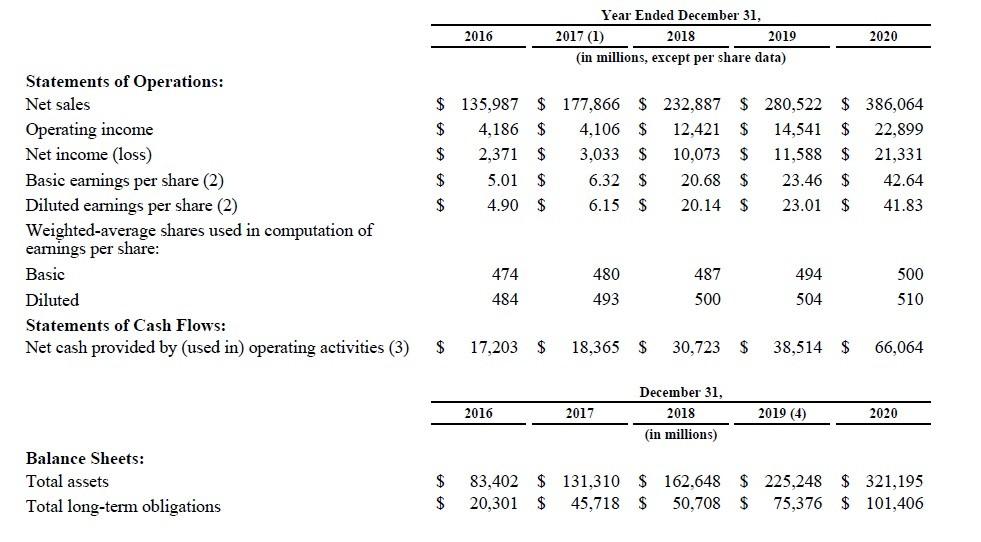
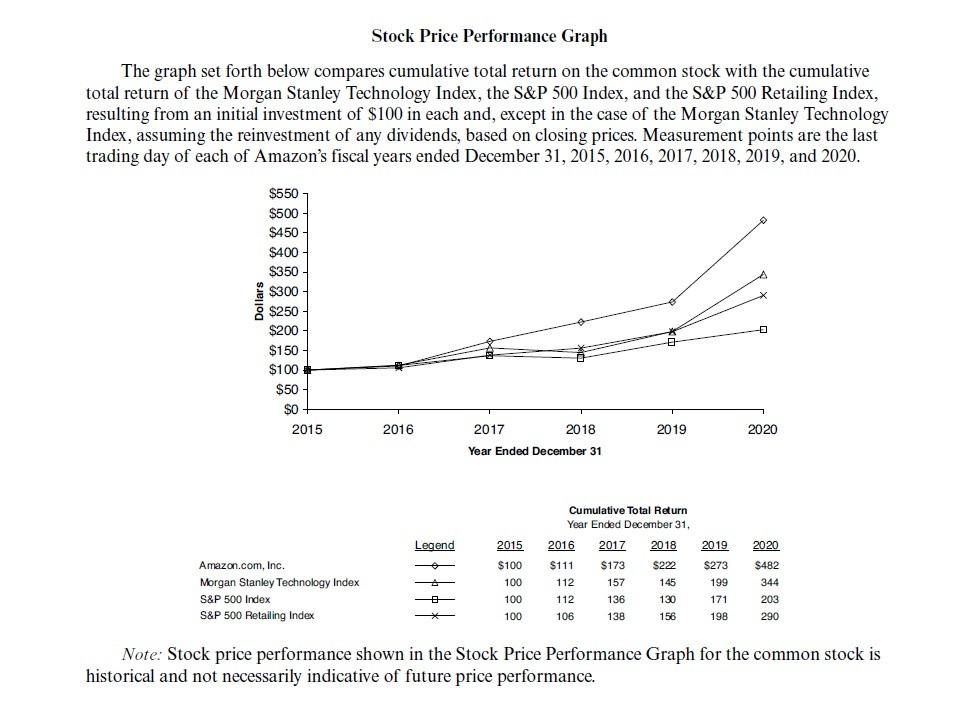
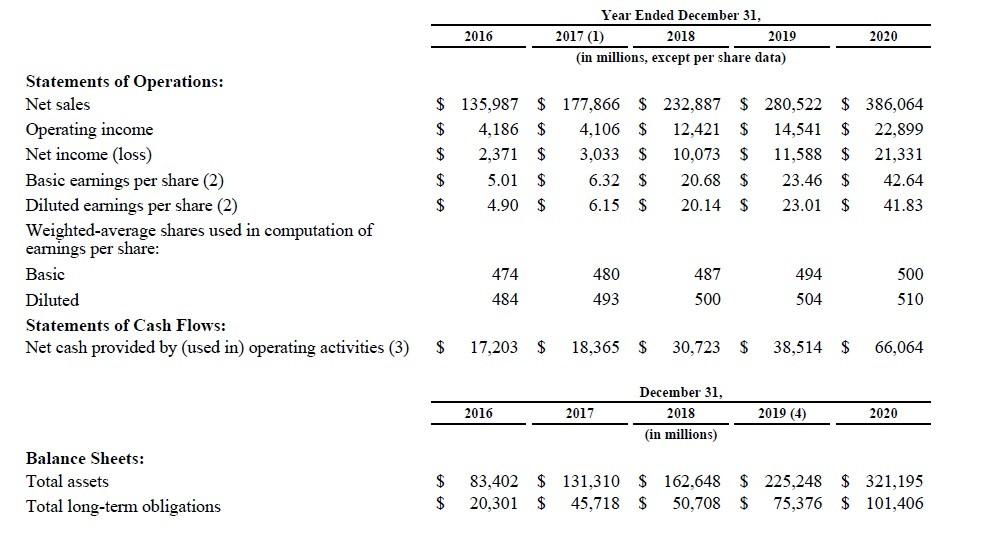
2016 Year Ended December 31, 2017 (1) 2018 2019 (in millions, except per share data) 2020 $ 135,987 $ 177,866 $ 232,887 $ 4,186 $ 4,106 $ 12.421 $ 280,522 $ 386,064 $ 14,541 $ 22,899 $ 11,588 $ 21,331 $ 2,371 $ 3,033 $ 10,073 Statements of Operations: Net sales Operating income Net income (loss) Basic earnings per share (2) Diluted earnings per share (2) Weighted average shares used in computation of earnings per share: Basic $ 5.01 $ 6.32 $ 20.68 $ 23.46 $ 42.64 $ 4.90 $ 6.15 $ 20.14 $ 23.01 $ 41.83 474 480 487 494 500 Diluted 484 493 500 504 510 Statements of Cash Flows: Net cash provided by (used in) operating activities (3) $ 17,203 $ 18,365 $ 30.723 $ 38,514 $ 66,064 December 31, 2018 2016 2017 2019 (4) 2020 (in millions) Balance Sheets: Total assets $ $ 83,402 $ 131,310 $ 162,648 $ 225,248 $ 321,195 20,301 $ 45,718 $ 50.708 $ 75,376 $ 101,406 Total long-term obligations Stock Price Performance Graph The graph set forth below compares cumulative total return on the common stock with the cumulative total return of the Morgan Stanley Technology Index, the S&P 500 Index, and the S&P 500 Retailing Index, resulting from an initial investment of $100 in each and, except in the case of the Morgan Stanley Technology Index, assuming the reinvestment of any dividends, based on closing prices. Measurement points are the last trading day of each of Amazon's fiscal years ended December 31, 2015, 2016, 2017, 2018, 2019, and 2020. $550 $500 $450 $400 $350 $300 Dollars $250 $200 $150 $100 $50 SO 2015 2016 2017 2018 2019 2020 Year Ended December 31 Cumulative Total Return , Legend 2015 2016 2017 2018 2019 2020 $100 $111 $173 S222 $273 $482 100 112 157 145 199 344 Amazon.com, Inc. Morgan Stanley Technology Index S&P 500 Index & S&P 500 Retailing Index 100 112 136 130 171 203 100 106 138 158 198 290 Note: Stock price performance shown in the Stock Price Performance Graph for the common stock is historical and not necessarily indicative of future price performance. 2016 Year Ended December 31, 2017 (1) 2018 2019 (in millions, except per share data) 2020 $ 135,987 $ 177,866 $ 232,887 $ 4,186 $ 4,106 $ 12.421 $ 280,522 $ 386,064 $ 14,541 $ 22,899 $ 11,588 $ 21,331 $ 2,371 $ 3,033 $ 10,073 Statements of Operations: Net sales Operating income Net income (loss) Basic earnings per share (2) Diluted earnings per share (2) Weighted average shares used in computation of earnings per share: Basic $ 5.01 $ 6.32 $ 20.68 $ 23.46 $ 42.64 $ 4.90 $ 6.15 $ 20.14 $ 23.01 $ 41.83 474 480 487 494 500 Diluted 484 493 500 504 510 Statements of Cash Flows: Net cash provided by (used in) operating activities (3) $ 17,203 $ 18,365 $ 30.723 $ 38,514 $ 66,064 December 31, 2018 2016 2017 2019 (4) 2020 (in millions) Balance Sheets: Total assets $ $ 83,402 $ 131,310 $ 162,648 $ 225,248 $ 321,195 20,301 $ 45,718 $ 50.708 $ 75,376 $ 101,406 Total long-term obligations 2016 Year Ended December 31, 2017 (1) 2018 2019 (in millions, except per share data) 2020 $ 135,987 $ 177,866 $ 232,887 $ 4,186 $ 4,106 $ 12.421 $ 280,522 $ 386,064 $ 14,541 $ 22,899 $ 11,588 $ 21,331 $ 2,371 $ 3,033 $ 10,073 Statements of Operations: Net sales Operating income Net income (loss) Basic earnings per share (2) Diluted earnings per share (2) Weighted average shares used in computation of earnings per share: Basic $ 5.01 $ 6.32 $ 20.68 $ 23.46 $ 42.64 $ 4.90 $ 6.15 $ 20.14 $ 23.01 $ 41.83 474 480 487 494 500 Diluted 484 493 500 504 510 Statements of Cash Flows: Net cash provided by (used in) operating activities (3) $ 17,203 $ 18,365 $ 30.723 $ 38,514 $ 66,064 December 31, 2018 2016 2017 2019 (4) 2020 (in millions) Balance Sheets: Total assets $ $ 83,402 $ 131,310 $ 162,648 $ 225,248 $ 321,195 20,301 $ 45,718 $ 50.708 $ 75,376 $ 101,406 Total long-term obligations Stock Price Performance Graph The graph set forth below compares cumulative total return on the common stock with the cumulative total return of the Morgan Stanley Technology Index, the S&P 500 Index, and the S&P 500 Retailing Index, resulting from an initial investment of $100 in each and, except in the case of the Morgan Stanley Technology Index, assuming the reinvestment of any dividends, based on closing prices. Measurement points are the last trading day of each of Amazon's fiscal years ended December 31, 2015, 2016, 2017, 2018, 2019, and 2020. $550 $500 $450 $400 $350 $300 Dollars $250 $200 $150 $100 $50 SO 2015 2016 2017 2018 2019 2020 Year Ended December 31 Cumulative Total Return , Legend 2015 2016 2017 2018 2019 2020 $100 $111 $173 S222 $273 $482 100 112 157 145 199 344 Amazon.com, Inc. Morgan Stanley Technology Index S&P 500 Index & S&P 500 Retailing Index 100 112 136 130 171 203 100 106 138 158 198 290 Note: Stock price performance shown in the Stock Price Performance Graph for the common stock is historical and not necessarily indicative of future price performance. 2016 Year Ended December 31, 2017 (1) 2018 2019 (in millions, except per share data) 2020 $ 135,987 $ 177,866 $ 232,887 $ 4,186 $ 4,106 $ 12.421 $ 280,522 $ 386,064 $ 14,541 $ 22,899 $ 11,588 $ 21,331 $ 2,371 $ 3,033 $ 10,073 Statements of Operations: Net sales Operating income Net income (loss) Basic earnings per share (2) Diluted earnings per share (2) Weighted average shares used in computation of earnings per share: Basic $ 5.01 $ 6.32 $ 20.68 $ 23.46 $ 42.64 $ 4.90 $ 6.15 $ 20.14 $ 23.01 $ 41.83 474 480 487 494 500 Diluted 484 493 500 504 510 Statements of Cash Flows: Net cash provided by (used in) operating activities (3) $ 17,203 $ 18,365 $ 30.723 $ 38,514 $ 66,064 December 31, 2018 2016 2017 2019 (4) 2020 (in millions) Balance Sheets: Total assets $ $ 83,402 $ 131,310 $ 162,648 $ 225,248 $ 321,195 20,301 $ 45,718 $ 50.708 $ 75,376 $ 101,406 Total long-term obligations
Step by Step Solution
There are 3 Steps involved in it
Step: 1

Get Instant Access to Expert-Tailored Solutions
See step-by-step solutions with expert insights and AI powered tools for academic success
Step: 2

Step: 3

Ace Your Homework with AI
Get the answers you need in no time with our AI-driven, step-by-step assistance
Get Started


