

Answered step by step
Verified Expert Solution
Question
1 Approved Answer
Old MathJax webview Answer the above question with the help of above table. please explain everything in details A U per pur. cur per Con
Old MathJax webview
Answer the above question with the help of above table. please explain everything in details
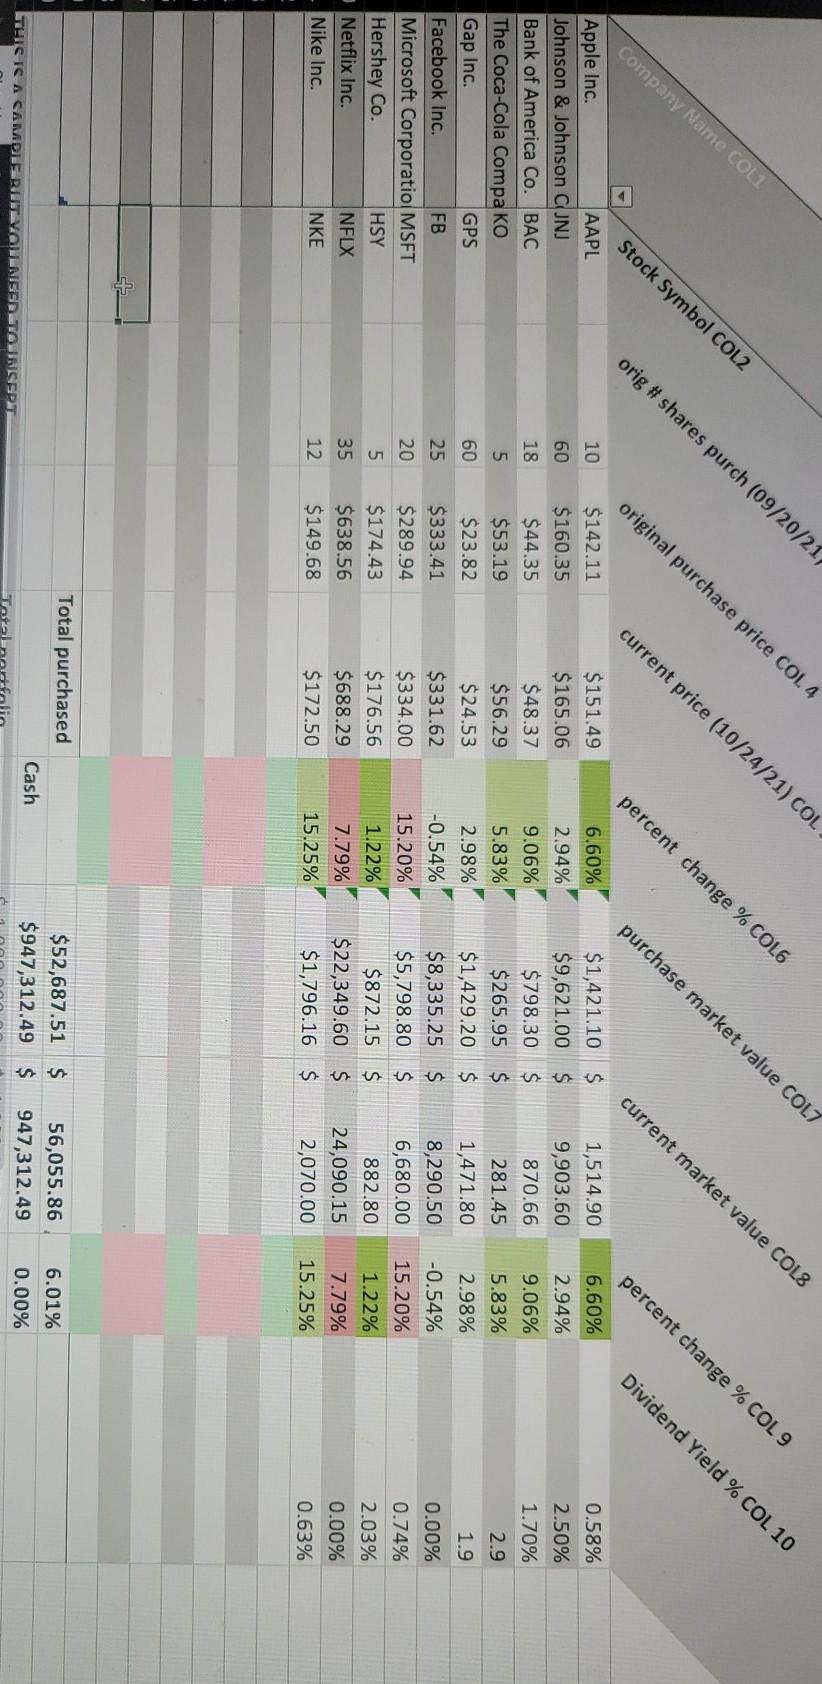
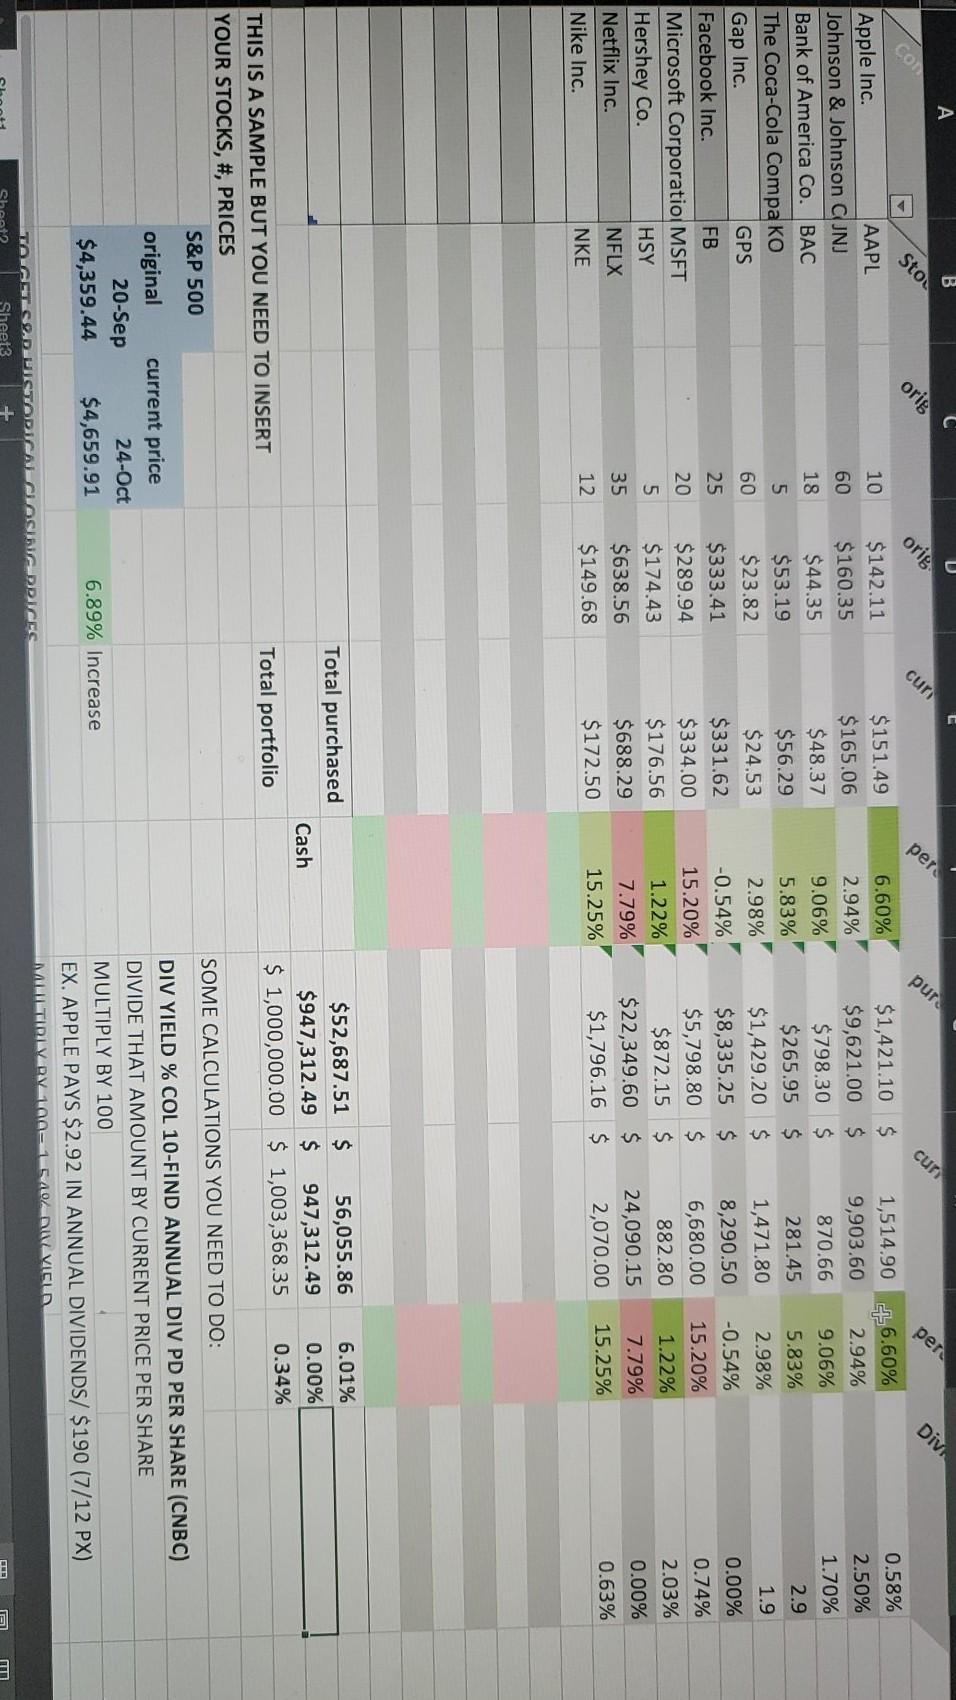
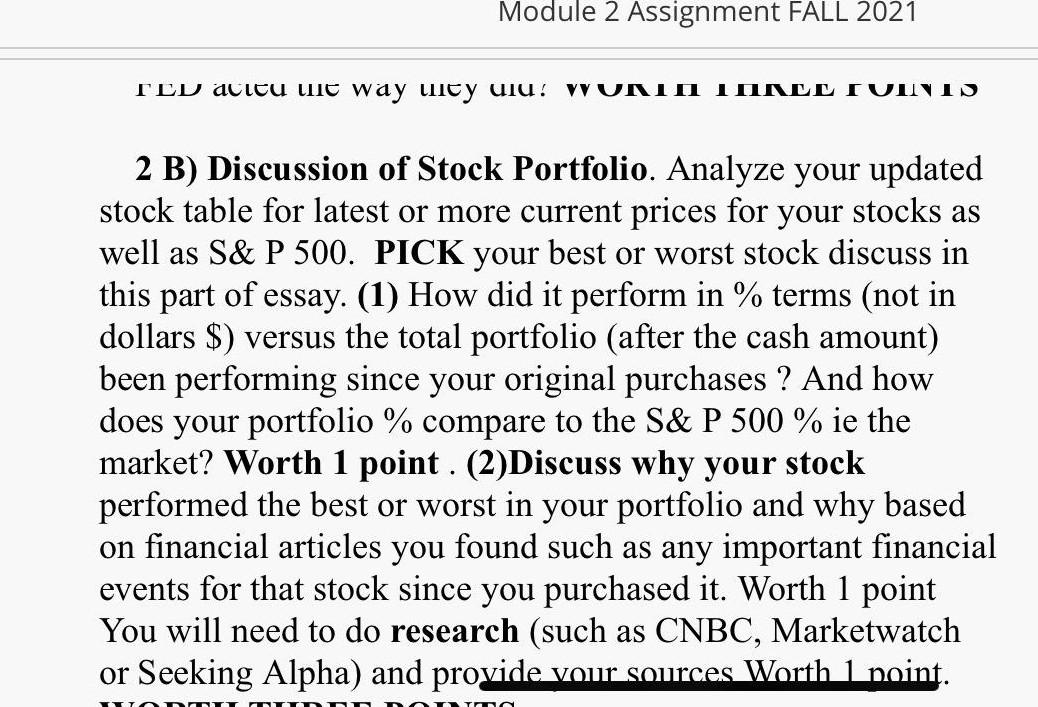
A U per pur. cur per Con Div. Stou orig orig cur 10 60 18 0.58% 2.50% 1.70% 2.9 5 1.9 Gap Inc. Apple Inc. AAPL Johnson & Johnson C JNJ Bank of America Co. BAC The Coca-Cola Compa KO GPS Facebook Inc. FB Microsoft Corporatio: MSFT Hershey Co. HSY Netflix Inc. NFLX Nike Inc. NKE 60 25 20 $142.11 $160.35 $44.35 $53.19 $23.82 $333.41 $289.94 $174.43 $638.56 $149.68 $151.49 $165.06 $48.37 $56.29 $24.53 $331.62 $334.00 $176.56 $688.29 $172.50 6.60% 2.94% 9.06% 5.83% 2.98% -0.54% 15.20% 1.22% 7.79% 15.25% $1,421.10 $ $9,621.00 $ $798.30 $ $265.95 $ $1,429.20 $ $8,335.25 $ $5,798.80 $ $872.15 $ $22,349.60 $ $1,796.16 $ 1,514.90 46.60% 9,903.60 2.94% 870.66 9.06% 281.45 5.83% 1,471.80 2.98% 8,290.50 -0.54% 6,680.00 15.20% 882.80 1.22% 24,090.15 7.79% 2,070.00 15.25% 0.00% 0.74% 2.03% 0.00% 0.63% 5 35 12 Total purchased Cash $52,687.51 $ 56,055.86 $947,312.49 $ 947,312.49 $ 1,000,000.00 $ 1,003,368.35 6.01% 0.00% 0.34% Total portfolio THIS IS A SAMPLE BUT YOU NEED TO INSERT YOUR STOCKS, #, PRICES S&P 500 SOME CALCULATIONS YOU NEED TO DO: original current price 20-Sep 24-Oct $4,359.44 $4,659.91 DIV YIELD % COL 10-FIND ANNUAL DIV PD PER SHARE (CNBC) DIVIDE THAT AMOUNT BY CURRENT PRICE PER SHARE MULTIPLY BY 100 EX. APPLE PAYS $2.92 IN ANNUAL DIVIDENDS/ $190 (7/12 PX) MILTIRLY RY 40 LV VIELD 6.89% Increase TAGSTOD ISTODICAL CLOSIR DDICES Sheet3 Shoot Module 2 Assignment FALL 2021 ICD acicu ule way wiey ulu! WONIA TANEL IUINI 2 B) Discussion of Stock Portfolio. Analyze your updated stock table for latest or more current prices for your stocks as well as S& P 500. PICK your best or worst stock discuss in this part of essay. (1) How did it perform in % terms (not in dollars $) versus the total portfolio (after the cash amount) been performing since your original purchases ? And how does your portfolio % compare to the S& P 500 % ie the market? Worth 1 point. (2)Discuss why your stock performed the best or worst in your portfolio and why based on financial articles you found such as any important financial events for that stock since you purchased it. Worth 1 point You will need to do research (such as CNBC, Marketwatch or Seeking Alpha) and provide vour sources Worth 1 point. Company Name COL1 Stock Symbol COL2 orig # shares purch (09/20/21 original purchase price COL 4 current price (10/24/21) COL percent change % COL6 purchase market value COLT current market value COLS percent change % COL 9 Dividend Yield % COL 10 10 60 0.58% 2.50% 1.70% 2.9 18 5 60 1.9 Apple Inc. AAPL Johnson & Johnson CJNJ Bank of America Co. BAC The Coca-Cola Compa KO Gap Inc. GPS Facebook Inc. FB Microsoft Corporatio MSFT Hershey Co. HSY Netflix Inc. NFLX Nike Inc. INKE $142.11 $160.35 $44.35 $53.19 $23.82 $333.41 $289.94 $174.43 $638.56 $149.68 $151.49 $165.06 $48.37 $56.29 $24.53 $331.62 $334.00 $176.56 $688.29 $172.50 6.60% 2.94% 9.06% 5.83% 2.98% -0.54% 15.20% 1.22% 7.79% 15.25% $1,421.10 $ $9,621.00 $ $798.30 $ $265.95 $ $1,429.20 $ $8,335.25 $ $5,798.80 $ $872.15 $ $22,349.60 $ $1,796.16 $ 1,514.90 9,903.60 870.66 281.45 1,471.80 8,290.50 6,680.00 882.80 24,090.15 2,070.00 6.60% 2.94% 9.06% 5.83% 2.98% -0.54% 15.20% 1.22% 7.79% 15.25% 25 20 5 0.00% 0.74% 2.03% 0.00% 0.63% 35 12 Total purchased 6.01% $52,687.51 $ $947,312.49 $ Cash 56,055.86 947,312.49 THIS IS A CAMDLERUTVALNISED TO INSEPT 0.00% A U per pur. cur per Con Div. Stou orig orig cur 10 60 18 0.58% 2.50% 1.70% 2.9 5 1.9 Gap Inc. Apple Inc. AAPL Johnson & Johnson C JNJ Bank of America Co. BAC The Coca-Cola Compa KO GPS Facebook Inc. FB Microsoft Corporatio: MSFT Hershey Co. HSY Netflix Inc. NFLX Nike Inc. NKE 60 25 20 $142.11 $160.35 $44.35 $53.19 $23.82 $333.41 $289.94 $174.43 $638.56 $149.68 $151.49 $165.06 $48.37 $56.29 $24.53 $331.62 $334.00 $176.56 $688.29 $172.50 6.60% 2.94% 9.06% 5.83% 2.98% -0.54% 15.20% 1.22% 7.79% 15.25% $1,421.10 $ $9,621.00 $ $798.30 $ $265.95 $ $1,429.20 $ $8,335.25 $ $5,798.80 $ $872.15 $ $22,349.60 $ $1,796.16 $ 1,514.90 46.60% 9,903.60 2.94% 870.66 9.06% 281.45 5.83% 1,471.80 2.98% 8,290.50 -0.54% 6,680.00 15.20% 882.80 1.22% 24,090.15 7.79% 2,070.00 15.25% 0.00% 0.74% 2.03% 0.00% 0.63% 5 35 12 Total purchased Cash $52,687.51 $ 56,055.86 $947,312.49 $ 947,312.49 $ 1,000,000.00 $ 1,003,368.35 6.01% 0.00% 0.34% Total portfolio THIS IS A SAMPLE BUT YOU NEED TO INSERT YOUR STOCKS, #, PRICES S&P 500 SOME CALCULATIONS YOU NEED TO DO: original current price 20-Sep 24-Oct $4,359.44 $4,659.91 DIV YIELD % COL 10-FIND ANNUAL DIV PD PER SHARE (CNBC) DIVIDE THAT AMOUNT BY CURRENT PRICE PER SHARE MULTIPLY BY 100 EX. APPLE PAYS $2.92 IN ANNUAL DIVIDENDS/ $190 (7/12 PX) MILTIRLY RY 40 LV VIELD 6.89% Increase TAGSTOD ISTODICAL CLOSIR DDICES Sheet3 Shoot Module 2 Assignment FALL 2021 ICD acicu ule way wiey ulu! WONIA TANEL IUINI 2 B) Discussion of Stock Portfolio. Analyze your updated stock table for latest or more current prices for your stocks as well as S& P 500. PICK your best or worst stock discuss in this part of essay. (1) How did it perform in % terms (not in dollars $) versus the total portfolio (after the cash amount) been performing since your original purchases ? And how does your portfolio % compare to the S& P 500 % ie the market? Worth 1 point. (2)Discuss why your stock performed the best or worst in your portfolio and why based on financial articles you found such as any important financial events for that stock since you purchased it. Worth 1 point You will need to do research (such as CNBC, Marketwatch or Seeking Alpha) and provide vour sources Worth 1 point. Company Name COL1 Stock Symbol COL2 orig # shares purch (09/20/21 original purchase price COL 4 current price (10/24/21) COL percent change % COL6 purchase market value COLT current market value COLS percent change % COL 9 Dividend Yield % COL 10 10 60 0.58% 2.50% 1.70% 2.9 18 5 60 1.9 Apple Inc. AAPL Johnson & Johnson CJNJ Bank of America Co. BAC The Coca-Cola Compa KO Gap Inc. GPS Facebook Inc. FB Microsoft Corporatio MSFT Hershey Co. HSY Netflix Inc. NFLX Nike Inc. INKE $142.11 $160.35 $44.35 $53.19 $23.82 $333.41 $289.94 $174.43 $638.56 $149.68 $151.49 $165.06 $48.37 $56.29 $24.53 $331.62 $334.00 $176.56 $688.29 $172.50 6.60% 2.94% 9.06% 5.83% 2.98% -0.54% 15.20% 1.22% 7.79% 15.25% $1,421.10 $ $9,621.00 $ $798.30 $ $265.95 $ $1,429.20 $ $8,335.25 $ $5,798.80 $ $872.15 $ $22,349.60 $ $1,796.16 $ 1,514.90 9,903.60 870.66 281.45 1,471.80 8,290.50 6,680.00 882.80 24,090.15 2,070.00 6.60% 2.94% 9.06% 5.83% 2.98% -0.54% 15.20% 1.22% 7.79% 15.25% 25 20 5 0.00% 0.74% 2.03% 0.00% 0.63% 35 12 Total purchased 6.01% $52,687.51 $ $947,312.49 $ Cash 56,055.86 947,312.49 THIS IS A CAMDLERUTVALNISED TO INSEPT 0.00%
Step by Step Solution
There are 3 Steps involved in it
Step: 1

Get Instant Access to Expert-Tailored Solutions
See step-by-step solutions with expert insights and AI powered tools for academic success
Step: 2

Step: 3
Ace Your Homework with AI
Get the answers you need in no time with our AI-driven, step-by-step assistance
Get Started
The Pillars Of Finance The Misalignment Of Finance Theory And Investment Practice
Authors: G. Fraser-Sampson
2014th Edition
1137264055, 978-1137264053