

Answered step by step
Verified Expert Solution
Question
1 Approved Answer
Old MathJax webview b and c part will open on doing part a firstly I'll post b and c part as well based on answer
Old MathJax webview
b and c part will open on doing part a firstly

I'll post b and c part as well based on answer of a
that is not given in the question
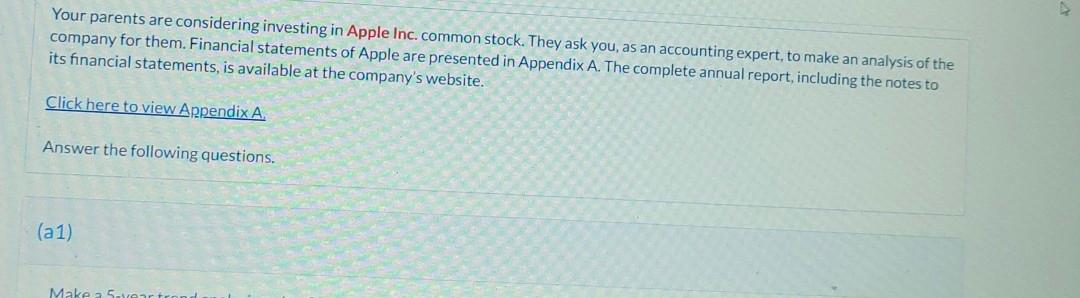
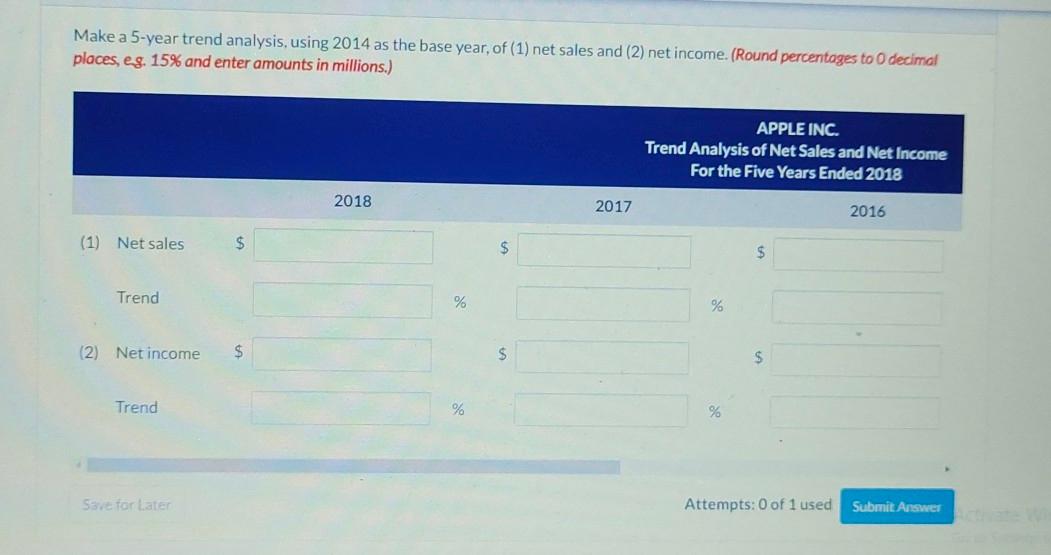
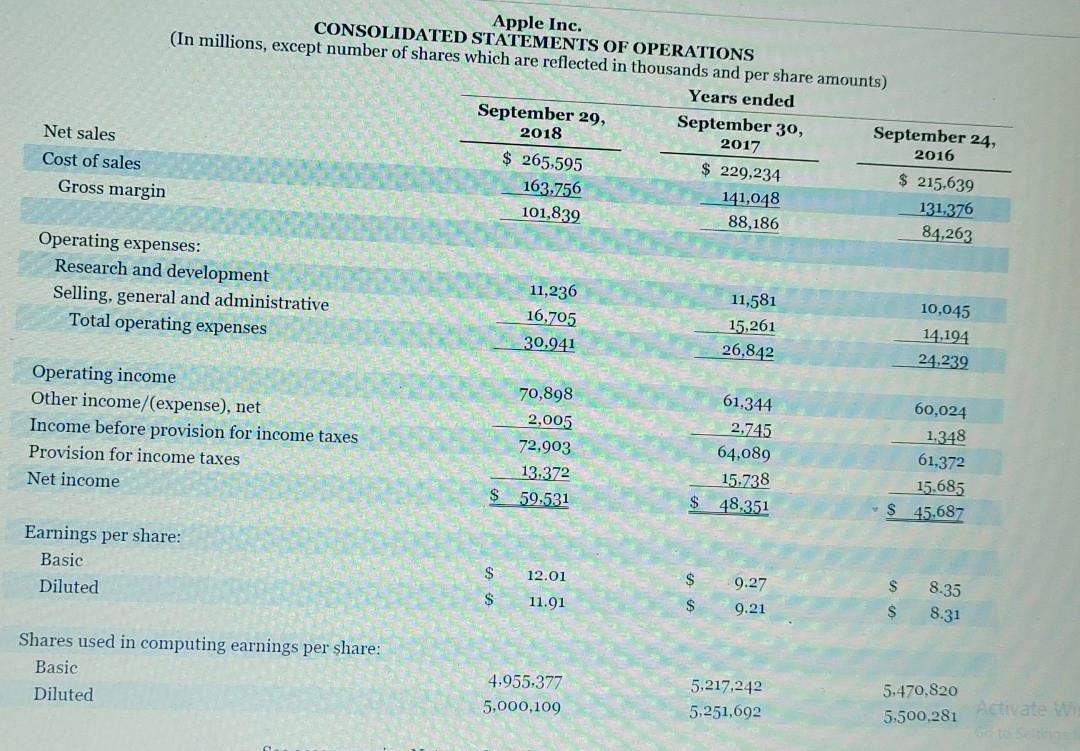
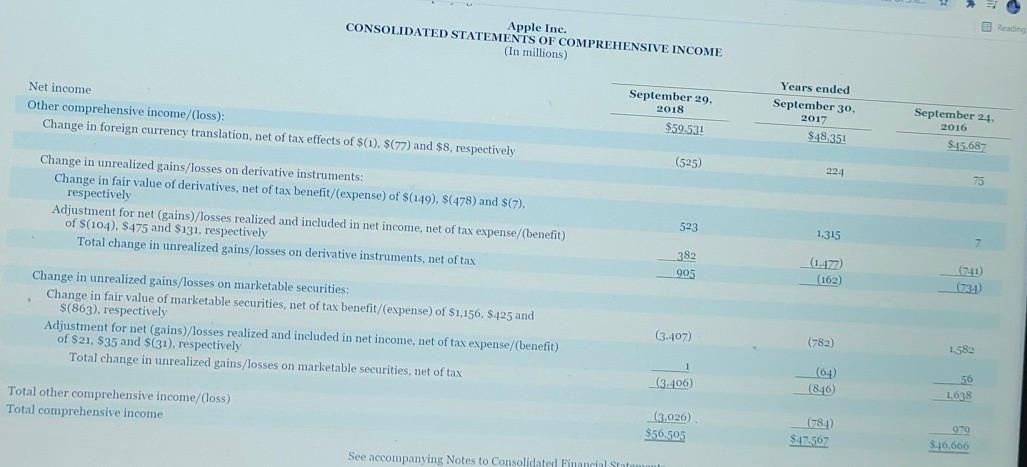
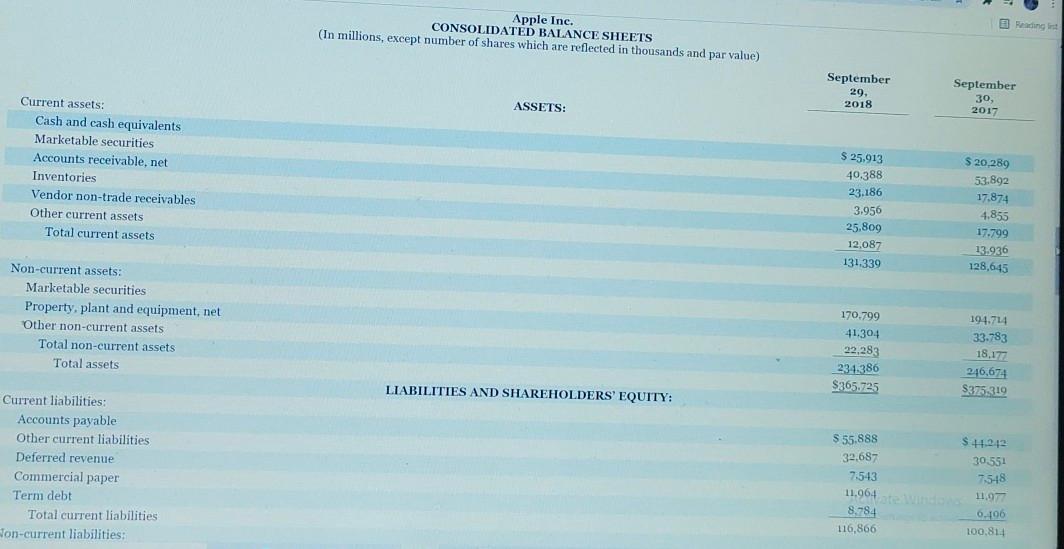
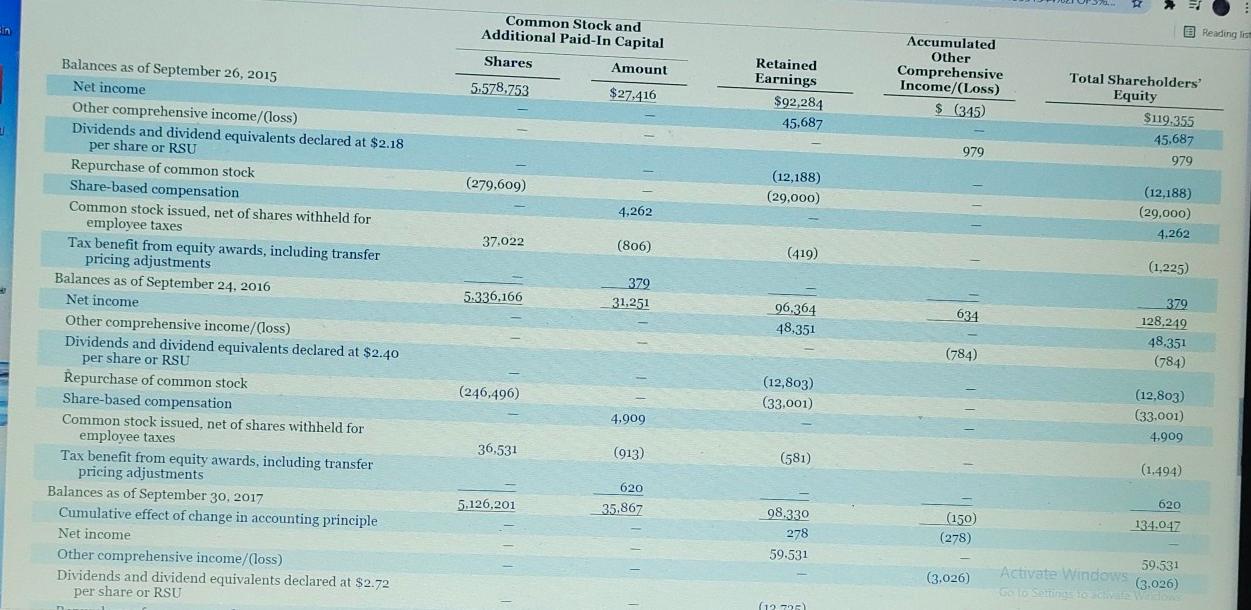
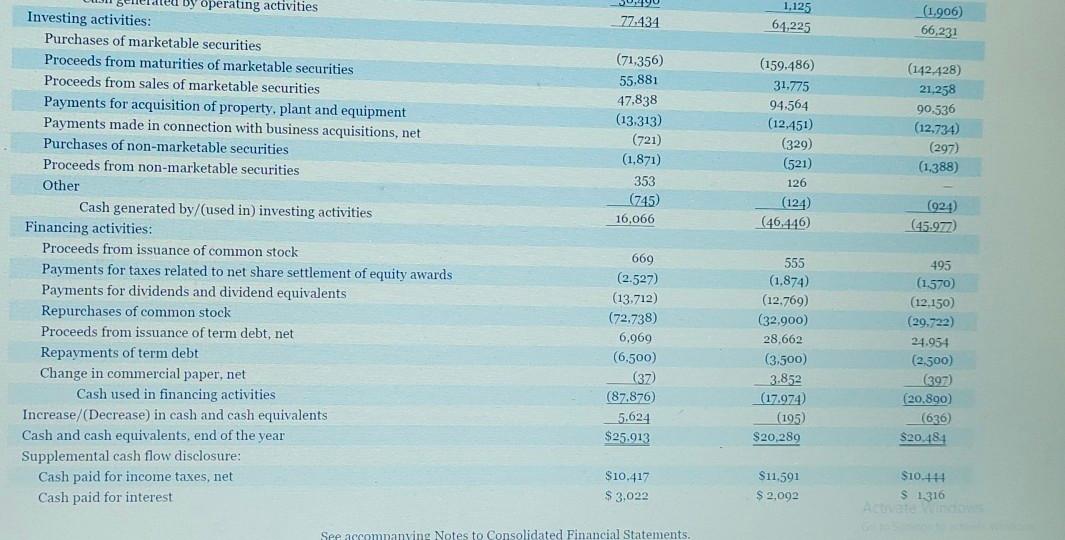
Your parents are considering investing in Apple Inc. common stock. They ask you, as an accounting expert, to make an analysis of the company for them. Financial statements of Apple are presented in Appendix A. The complete annual report, including the notes to its financial statements, is available at the company's website. Click here to view Appendix A. Answer the following questions, (a1) Make a ser Make a 5-year trend analysis, using 2014 as the base year, of (1) net sales and (2) net income. (Round percentages to 0 decimal places, eg. 15% and enter amounts in millions.) APPLE INC. Trend Analysis of Net Sales and Net Income For the Five Years Ended 2018 2018 2017 2016 (1) Net sales $ $ Trend % % (2) Net income $ $ Trend % % Save for later Attempts: 0 of 1 used Submit Answer Apple Inc. CONSOLIDATED STATEMENTS OF OPERATIONS (In millions, except number of shares which are reflected in thousands and per share amounts) Years ended September 29, September 30, September 24, 2018 2017 2016 Net sales $ 265,595 $ 229,234 $ 215,639 Cost of sales 163,756 141,048 131,376 Gross margin 101,839 88,186 84,263 Operating expenses: Research and development Selling, general and administrative Total operating expenses 11,581 11,236 16,705 30,941 15,261 26,842 10,045 14,194 24,239 Operating income Other income/(expense), net Income before provision for income taxes Provision for income taxes Net income 70,898 2,005 72,903 13.372 59.531 61,344 2,745 64,089 15.738 $ 48,351 60,024 1,348 61,372 15,685 $ 45,687 $ Earnings per share: Basic Diluted $ 12.01 9.27 S 8.35 $ 11.91 $ 9.21 $ 8.31 Shares used in computing earnings per share: Basic Diluted 4,955.377 5,000,109 5,217,242 5,251,692 5,470,820 5,500,281 Activate w Apple Inc. CONSOLIDATED STATEMENTS OF COMPREHENSIVE INCOME (In millions) Net income Other comprehensive income/(loss): Change in foreign currency translation, net of tax effects of S(1). $(77) and $8, respectively September 29, 2018 $59.531 Years ended September 30, 2017 $48,351 September 24, 2016 $15.687 (525) 22. 75 Change in unrealized gains/losses on derivative instruments: Change in fair value of derivatives, net of tax benefit/(expense) of $(149). $(478) and $(7). respectively Adjustment for net (gains)/losses realized and included in net income, net of tax expense/(benefit) of $(104). $475 and $131, respectively Total change in unrealized gains/losses on derivative instruments, net of tax 523 1.315 382 905 (162) (734) Change in unrealized gains/losses on marketable securities: Change in fair value of marketable securities, net of tax benefit/(expense) of $1,156, $425 and S(863), respectively Adjustment for net (gains)/losses realized and included in net income, net of tax expense/(benefit) of $21. $35 and $(31), respectively Total change in unrealized gains/losses on marketable securities, net of tax (3.407) (782) 1.583 (3406) (6) (846) Total other comprehensive income/Closs) Total comprehensive income 1.098 (3,026) $56.505 (784) $4756 079 8.10.606 See accompanving Notes to Consolidated Financial Stat Apple Inc. CONSOLIDATED BALANCE SHEETS (In millions, except number of shares which are reflected in thousands and par value) Reading September 29 September 30, 2017 ASSETS: 2018 Current assets: Cash and cash equivalents Marketable securities Accounts receivable, net Inventories Vendor non-trade receivables Other current assets Total current assets $ 25,913 40.388 23.186 3.956 25,809 12,087 131339 $ 20,289 53.892 17.874 4,855 17.799 13.936 128,645 Non-current assets: Marketable securities Property, plant and equipment, net Other non-current assets Total non-current assets Total assets 170.799 41.304 22,283 234.386 $365.725 194.714 33.783 18,177 246,674 $375.319 LIABILITIES AND SHAREHOLDERS' EQUITY: Current liabilities: Accounts payable Other current liabilities Deferred revenue Commercial paper Term debt Total current liabilities Non-current liabilities: $ 55.888 $ 44.242 32.687 30.551 7:543 7548 11,964 te 11.977 8.784 6.106 116,866 100,814 in Reading in Common Stock and Additional Paid-In Capital Shares Amount 5,578,753 $27,416 Retained Earnings $92,284 45,687 Accumulated Other Comprehensive Income/(Loss) $ (345) Total Shareholders' Equity $119.355 45,687 979 979 (279,609) (12,188) (29,000) 4,262 (12,188) (29,000) 4,262 37.022 (806) (419) (1,225) 5.336,166 379 31,251 Balances as of September 26, 2015 Net income Other comprehensive income/(loss) Dividends and dividend equivalents declared at $2.18 per share or RSU Repurchase of common stock Share-based compensation Common stock issued, net of shares withheld for employee taxes Tax benefit from equity awards, including transfer pricing adjustments Balances as of September 24, 2016 Net income Other comprehensive income/loss) Dividends and dividend equivalents declared at $2.40 per share or RSU Repurchase of common stock Share-based compensation Common stock issued, net of shares withheld for employee taxes Tax benefit from equity awards, including transfer pricing adjustments Balances as of September 30, 2017 Cumulative effect of change in accounting principle Net income Other comprehensive income/loss) Dividends and dividend equivalents declared at $2.72 per share or RSU 96,364 48,351 634 379 128.249 48.351 (784) (784) (246,496) (12,803) (33,001) 4,909 (12,803) (33.001) 4,909 36,531 (913) (581) (1,494) 5.126,201 620 35,867 620 134.047 98.330 278 59.531 (150) (278) (3,026) 59.531 Activate Windows (3.026) (1970) New Student Orient YouTube Maps 20%2Febook%2Fepub%2f9781119591341%2FOP5% M Gmail # : (405,549) E Reading list (73,056) Repurchase of common stock Share-based compensation Common stock issued, net of shares withheld for employee taxes Balances as of September 29, 2018 5,443 673.056) 5443 34,334 4.754.986 (1,109) $40,201 (948) $70,400 $(3454) (2,057) $107,147 See accompanying Notes to Consolidated Financial Statements. Apple Inc. CONSOLIDATED STATEMENTS OF CASH FLOWS (In millions) September 29, 2018 $20,289 Years ended September 30, 2017 $20,484 September 24, 2016 $21,120 59,531 48,351 45,687 45,687 Cash and cash equivalents, beginning of the year Operating activities: Net income Adjustments to reconcile net income to cash generated by operating activities: Depreciation and amortization Share-based compensation expense Deferred income tax expense/(benefit) Other Changes in operating assets and liabilities: Accounts receivable, net Inventories Vendor non-trade receivables Other current and non-current assets Accounts payable Deferred revenue Other current and non-current liabilities Cash generated by operating activities 10,903 5,340 (62,590) (444) 10,157 4,840 5,966 (166) 10,505 4.210 4,938 486 (5,322) 828 (8,010) (423) 9,175 (44) 38,490 77,434 (2,093) (2,723) (4,254) (5,318) 8,966 (626) 1,125 64,225 527 217 (51) 1,055 2.117 Activat(1.554)dows Go to Se (1.906) vote Windows 66,231 1,125 64,225 (1,906) 77.434 66,231 (71,356) 55,881 47,838 (13.313) (721) (1,871) 353 (745) 16,066 (159.486) 31.775 94,564 (12,451) (329) (521) 126 (124) (46,446 (142428) 21,258 90.536 (12,734) (297) (1.388) (924) (45.977) by operating activities Investing activities: Purchases of marketable securities Proceeds from maturities of marketable securities Proceeds from sales of marketable securities Payments for acquisition of property, plant and equipment Payments made in connection with business acquisitions, net Purchases of non-marketable securities Proceeds from non-marketable securities Other Cash generated by/(used in) investing activities Financing activities: Proceeds from issuance of common stock Payments for taxes related to net share settlement of equity awards Payments for dividends and dividend equivalents Repurchases of common stock Proceeds from issuance of term debt, net Repayments of term debt Change in commercial paper, net Cash used in financing activities Increase/(Decrease) in cash and cash equivalents Cash and cash equivalents, end of the year Supplemental cash flow disclosure: Cash paid for income taxes, net Cash paid for interest 669 (2.527 (13.712) (72,738) 6,969 (6.500) (37 (87.876) 5.624 $25.913 555 (1,874) (12.769) (32,900) 28,662 (3.500) 3.852 (17.974) (195) $20,289 495 (1.570) (12.150) (29.722) 24.954 (2,500) (397) (20.800) (636 $20.484 $10.417 $11,591 $10.444 $ 1316 $3,022 $ 2.092 See accompanyi Notes to Consolidated Financial Statements. Your parents are considering investing in Apple Inc. common stock. They ask you, as an accounting expert, to make an analysis of the company for them. Financial statements of Apple are presented in Appendix A. The complete annual report, including the notes to its financial statements, is available at the company's website. Click here to view Appendix A. Answer the following questions, (a1) Make a ser Make a 5-year trend analysis, using 2014 as the base year, of (1) net sales and (2) net income. (Round percentages to 0 decimal places, eg. 15% and enter amounts in millions.) APPLE INC. Trend Analysis of Net Sales and Net Income For the Five Years Ended 2018 2018 2017 2016 (1) Net sales $ $ Trend % % (2) Net income $ $ Trend % % Save for later Attempts: 0 of 1 used Submit Answer Apple Inc. CONSOLIDATED STATEMENTS OF OPERATIONS (In millions, except number of shares which are reflected in thousands and per share amounts) Years ended September 29, September 30, September 24, 2018 2017 2016 Net sales $ 265,595 $ 229,234 $ 215,639 Cost of sales 163,756 141,048 131,376 Gross margin 101,839 88,186 84,263 Operating expenses: Research and development Selling, general and administrative Total operating expenses 11,581 11,236 16,705 30,941 15,261 26,842 10,045 14,194 24,239 Operating income Other income/(expense), net Income before provision for income taxes Provision for income taxes Net income 70,898 2,005 72,903 13.372 59.531 61,344 2,745 64,089 15.738 $ 48,351 60,024 1,348 61,372 15,685 $ 45,687 $ Earnings per share: Basic Diluted $ 12.01 9.27 S 8.35 $ 11.91 $ 9.21 $ 8.31 Shares used in computing earnings per share: Basic Diluted 4,955.377 5,000,109 5,217,242 5,251,692 5,470,820 5,500,281 Activate w Apple Inc. CONSOLIDATED STATEMENTS OF COMPREHENSIVE INCOME (In millions) Net income Other comprehensive income/(loss): Change in foreign currency translation, net of tax effects of S(1). $(77) and $8, respectively September 29, 2018 $59.531 Years ended September 30, 2017 $48,351 September 24, 2016 $15.687 (525) 22. 75 Change in unrealized gains/losses on derivative instruments: Change in fair value of derivatives, net of tax benefit/(expense) of $(149). $(478) and $(7). respectively Adjustment for net (gains)/losses realized and included in net income, net of tax expense/(benefit) of $(104). $475 and $131, respectively Total change in unrealized gains/losses on derivative instruments, net of tax 523 1.315 382 905 (162) (734) Change in unrealized gains/losses on marketable securities: Change in fair value of marketable securities, net of tax benefit/(expense) of $1,156, $425 and S(863), respectively Adjustment for net (gains)/losses realized and included in net income, net of tax expense/(benefit) of $21. $35 and $(31), respectively Total change in unrealized gains/losses on marketable securities, net of tax (3.407) (782) 1.583 (3406) (6) (846) Total other comprehensive income/Closs) Total comprehensive income 1.098 (3,026) $56.505 (784) $4756 079 8.10.606 See accompanving Notes to Consolidated Financial Stat Apple Inc. CONSOLIDATED BALANCE SHEETS (In millions, except number of shares which are reflected in thousands and par value) Reading September 29 September 30, 2017 ASSETS: 2018 Current assets: Cash and cash equivalents Marketable securities Accounts receivable, net Inventories Vendor non-trade receivables Other current assets Total current assets $ 25,913 40.388 23.186 3.956 25,809 12,087 131339 $ 20,289 53.892 17.874 4,855 17.799 13.936 128,645 Non-current assets: Marketable securities Property, plant and equipment, net Other non-current assets Total non-current assets Total assets 170.799 41.304 22,283 234.386 $365.725 194.714 33.783 18,177 246,674 $375.319 LIABILITIES AND SHAREHOLDERS' EQUITY: Current liabilities: Accounts payable Other current liabilities Deferred revenue Commercial paper Term debt Total current liabilities Non-current liabilities: $ 55.888 $ 44.242 32.687 30.551 7:543 7548 11,964 te 11.977 8.784 6.106 116,866 100,814 in Reading in Common Stock and Additional Paid-In Capital Shares Amount 5,578,753 $27,416 Retained Earnings $92,284 45,687 Accumulated Other Comprehensive Income/(Loss) $ (345) Total Shareholders' Equity $119.355 45,687 979 979 (279,609) (12,188) (29,000) 4,262 (12,188) (29,000) 4,262 37.022 (806) (419) (1,225) 5.336,166 379 31,251 Balances as of September 26, 2015 Net income Other comprehensive income/(loss) Dividends and dividend equivalents declared at $2.18 per share or RSU Repurchase of common stock Share-based compensation Common stock issued, net of shares withheld for employee taxes Tax benefit from equity awards, including transfer pricing adjustments Balances as of September 24, 2016 Net income Other comprehensive income/loss) Dividends and dividend equivalents declared at $2.40 per share or RSU Repurchase of common stock Share-based compensation Common stock issued, net of shares withheld for employee taxes Tax benefit from equity awards, including transfer pricing adjustments Balances as of September 30, 2017 Cumulative effect of change in accounting principle Net income Other comprehensive income/loss) Dividends and dividend equivalents declared at $2.72 per share or RSU 96,364 48,351 634 379 128.249 48.351 (784) (784) (246,496) (12,803) (33,001) 4,909 (12,803) (33.001) 4,909 36,531 (913) (581) (1,494) 5.126,201 620 35,867 620 134.047 98.330 278 59.531 (150) (278) (3,026) 59.531 Activate Windows (3.026) (1970) New Student Orient YouTube Maps 20%2Febook%2Fepub%2f9781119591341%2FOP5% M Gmail # : (405,549) E Reading list (73,056) Repurchase of common stock Share-based compensation Common stock issued, net of shares withheld for employee taxes Balances as of September 29, 2018 5,443 673.056) 5443 34,334 4.754.986 (1,109) $40,201 (948) $70,400 $(3454) (2,057) $107,147 See accompanying Notes to Consolidated Financial Statements. Apple Inc. CONSOLIDATED STATEMENTS OF CASH FLOWS (In millions) September 29, 2018 $20,289 Years ended September 30, 2017 $20,484 September 24, 2016 $21,120 59,531 48,351 45,687 45,687 Cash and cash equivalents, beginning of the year Operating activities: Net income Adjustments to reconcile net income to cash generated by operating activities: Depreciation and amortization Share-based compensation expense Deferred income tax expense/(benefit) Other Changes in operating assets and liabilities: Accounts receivable, net Inventories Vendor non-trade receivables Other current and non-current assets Accounts payable Deferred revenue Other current and non-current liabilities Cash generated by operating activities 10,903 5,340 (62,590) (444) 10,157 4,840 5,966 (166) 10,505 4.210 4,938 486 (5,322) 828 (8,010) (423) 9,175 (44) 38,490 77,434 (2,093) (2,723) (4,254) (5,318) 8,966 (626) 1,125 64,225 527 217 (51) 1,055 2.117 Activat(1.554)dows Go to Se (1.906) vote Windows 66,231 1,125 64,225 (1,906) 77.434 66,231 (71,356) 55,881 47,838 (13.313) (721) (1,871) 353 (745) 16,066 (159.486) 31.775 94,564 (12,451) (329) (521) 126 (124) (46,446 (142428) 21,258 90.536 (12,734) (297) (1.388) (924) (45.977) by operating activities Investing activities: Purchases of marketable securities Proceeds from maturities of marketable securities Proceeds from sales of marketable securities Payments for acquisition of property, plant and equipment Payments made in connection with business acquisitions, net Purchases of non-marketable securities Proceeds from non-marketable securities Other Cash generated by/(used in) investing activities Financing activities: Proceeds from issuance of common stock Payments for taxes related to net share settlement of equity awards Payments for dividends and dividend equivalents Repurchases of common stock Proceeds from issuance of term debt, net Repayments of term debt Change in commercial paper, net Cash used in financing activities Increase/(Decrease) in cash and cash equivalents Cash and cash equivalents, end of the year Supplemental cash flow disclosure: Cash paid for income taxes, net Cash paid for interest 669 (2.527 (13.712) (72,738) 6,969 (6.500) (37 (87.876) 5.624 $25.913 555 (1,874) (12.769) (32,900) 28,662 (3.500) 3.852 (17.974) (195) $20,289 495 (1.570) (12.150) (29.722) 24.954 (2,500) (397) (20.800) (636 $20.484 $10.417 $11,591 $10.444 $ 1316 $3,022 $ 2.092 See accompanyi Notes to Consolidated Financial StatementsStep by Step Solution
There are 3 Steps involved in it
Step: 1

Get Instant Access to Expert-Tailored Solutions
See step-by-step solutions with expert insights and AI powered tools for academic success
Step: 2

Step: 3
Ace Your Homework with AI
Get the answers you need in no time with our AI-driven, step-by-step assistance
Get Started
Auditing A Modern Approach
Authors: Sanjay Basotia
1st Edition
938092903X, 978-9380929033