

Answered step by step
Verified Expert Solution
Question
1 Approved Answer
Old MathJax webview EARTHWEAR CLOTHIERS Ratio Analyses December 31, 2019 December 31 2015 2016 2017 2018 2019 2019 (Audited) (Audited) (Audited) (Audited) Expected Actual (unaudited)
Old MathJax webview
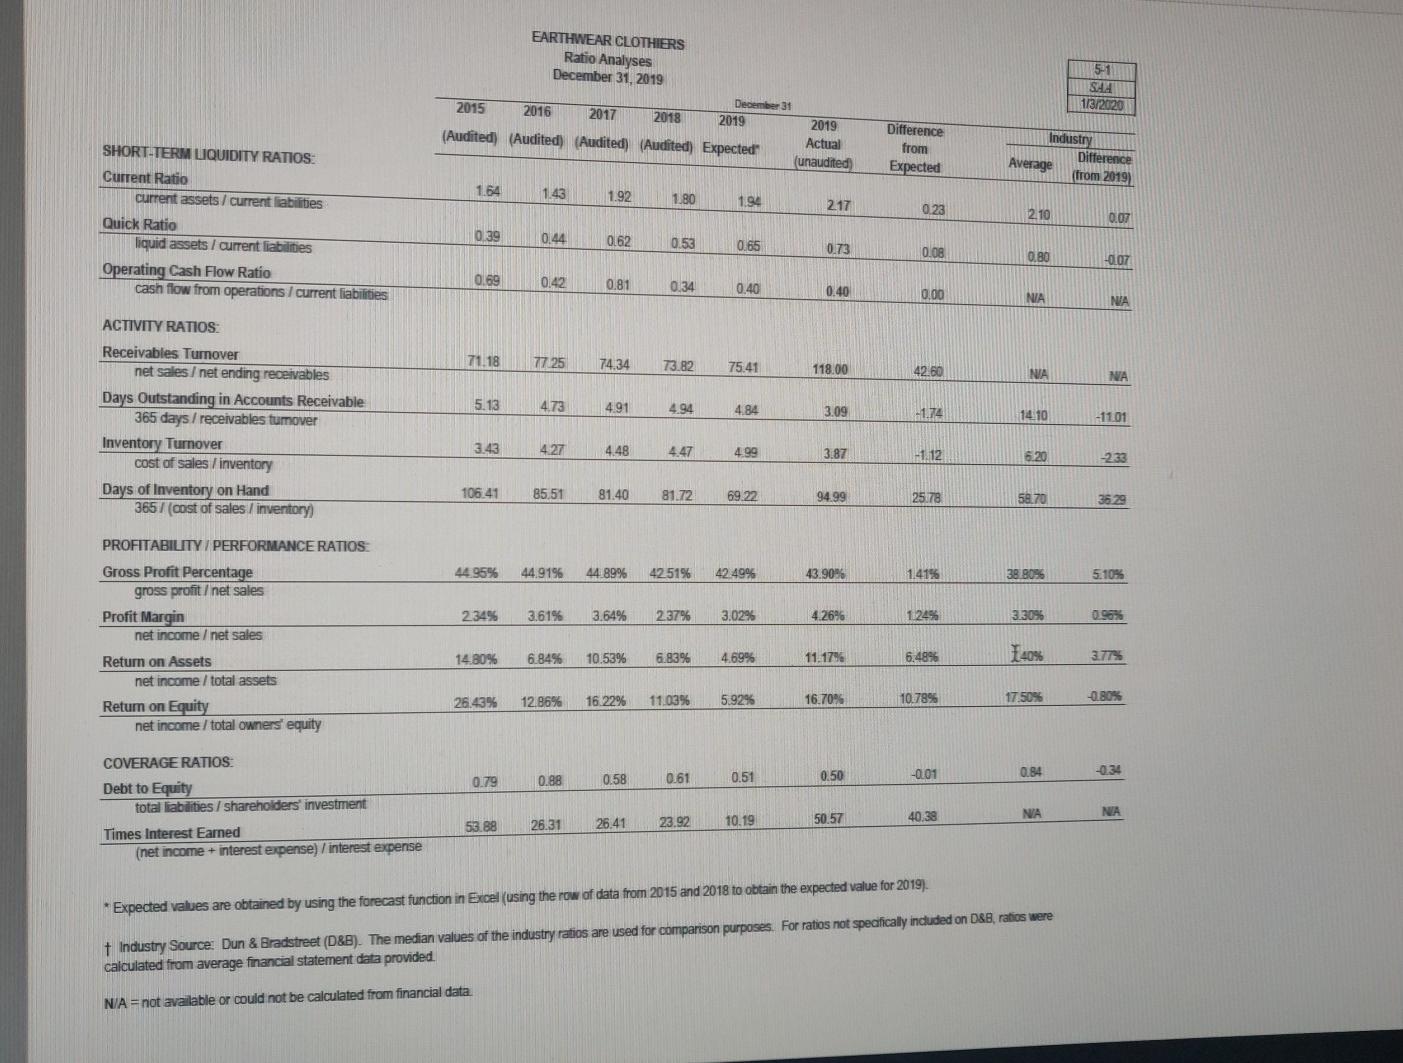
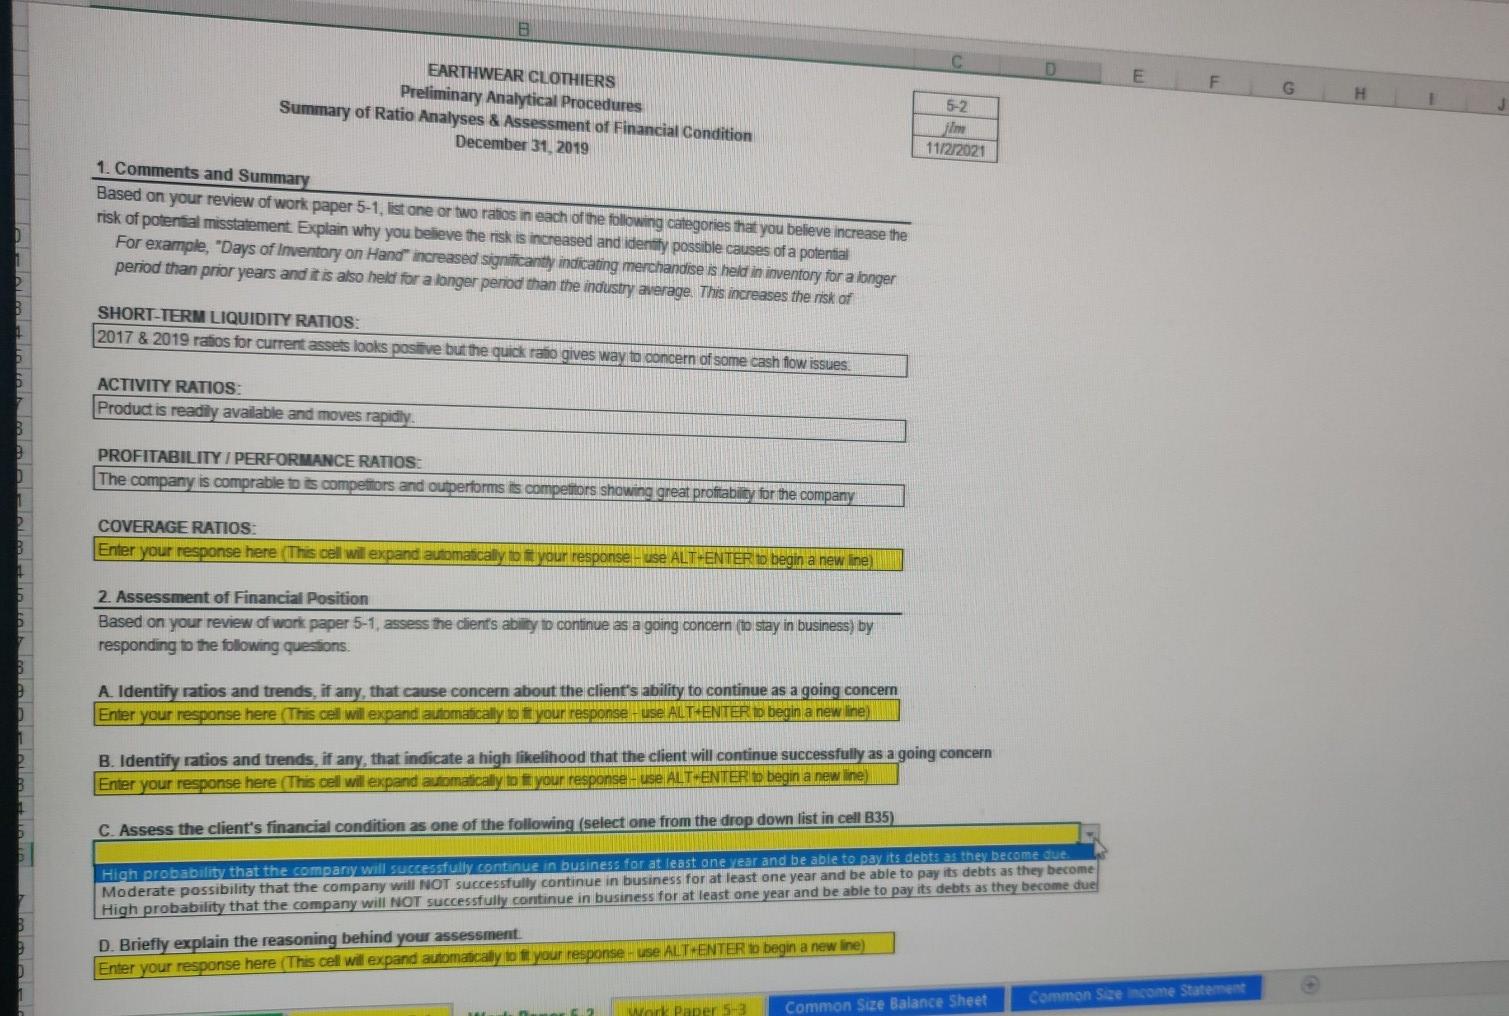
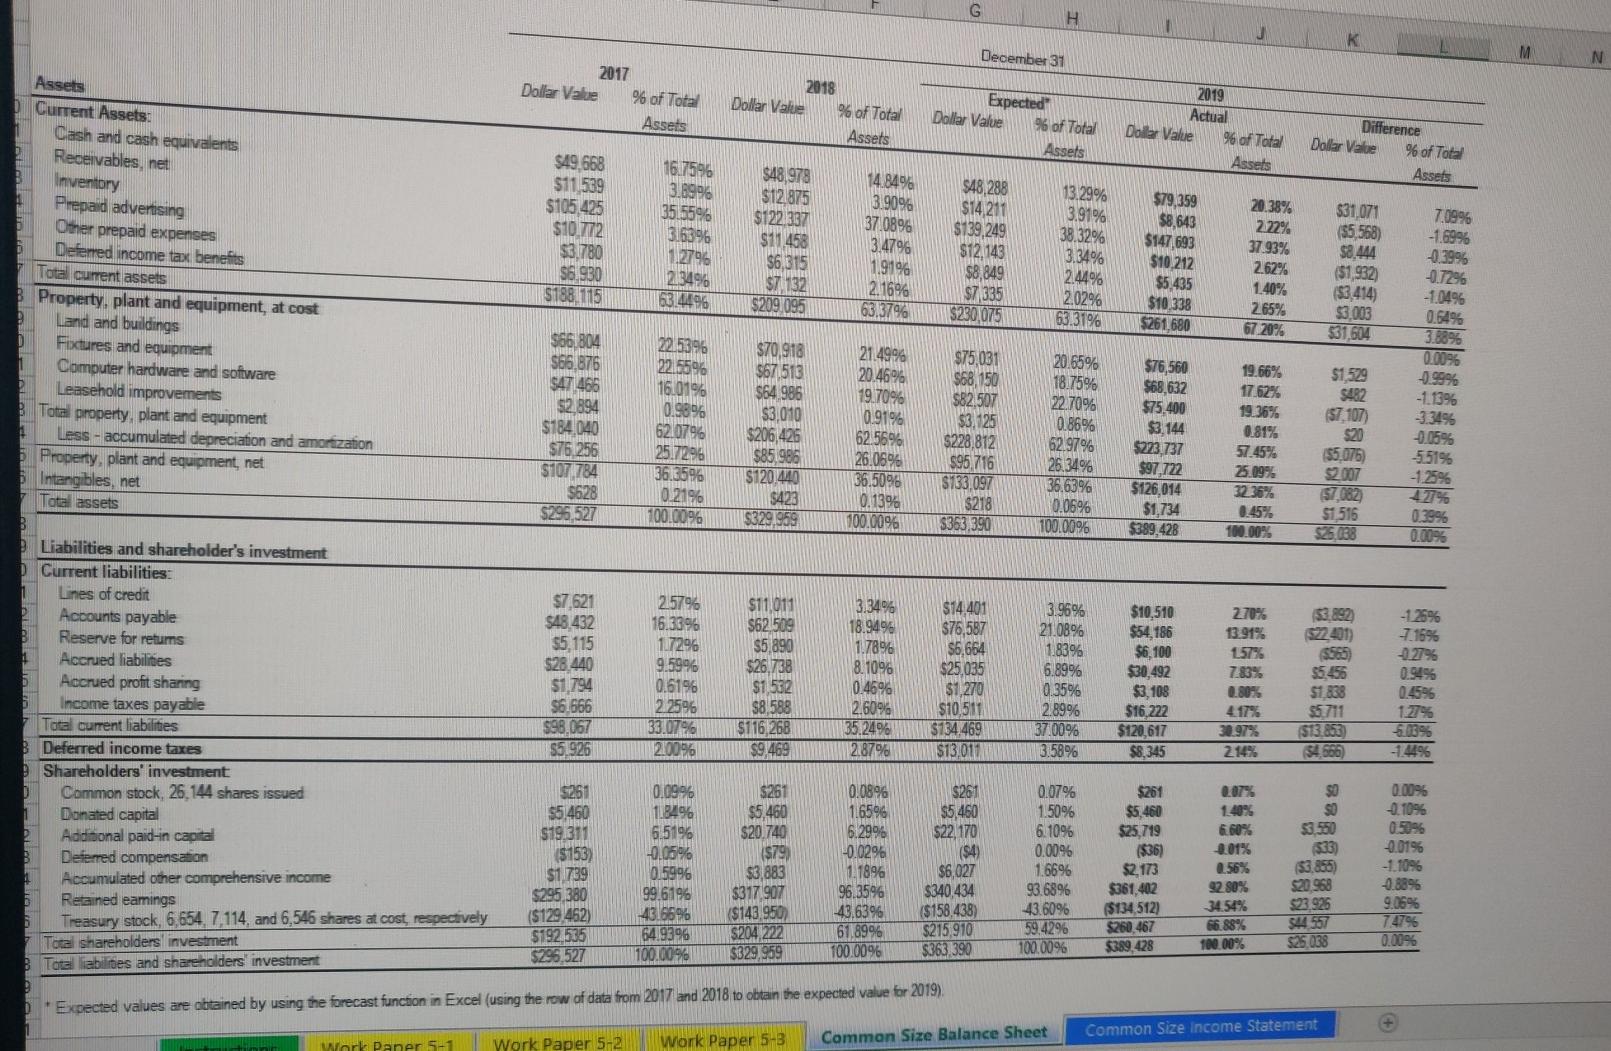
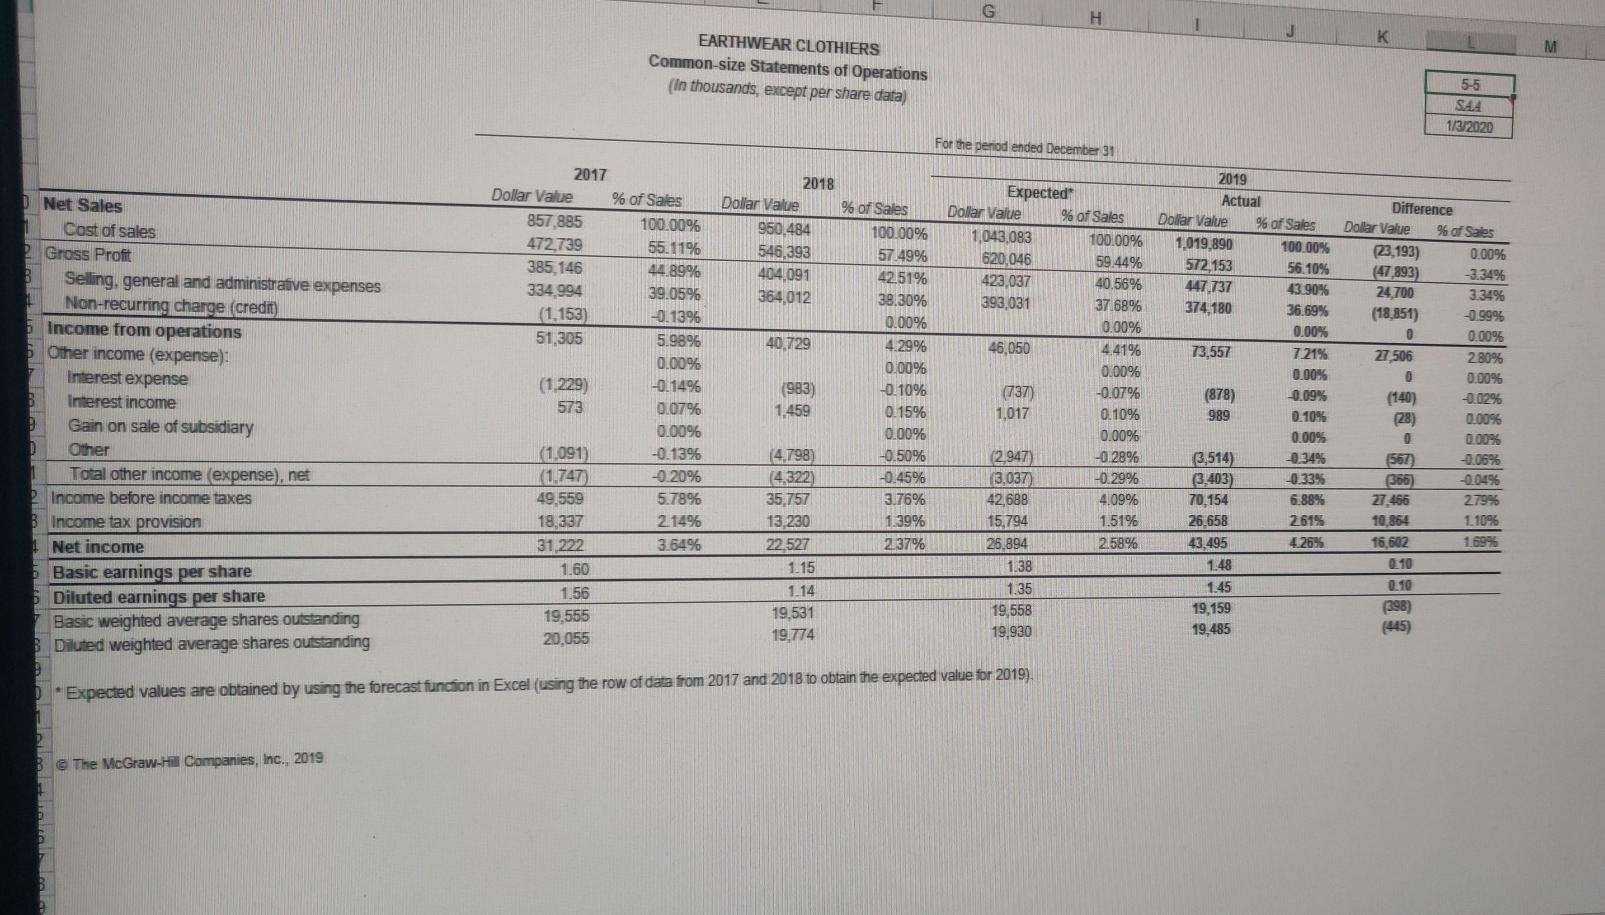
EARTHWEAR CLOTHIERS Ratio Analyses December 31, 2019 December 31 2015 2016 2017 2018 2019 2019 (Audited) (Audited) (Audited) (Audited) Expected" Actual (unaudited) 511 SAH 1/3/2020 Difference from Expected Industry Difference Average (from 2019) 1.64 1.43 1.92 1.80 1.94 2.17 0.23 2.10 SHORT-TERM LIQUIDITY RATIOS: Current Ratio current assets/ current liabilities Quick Ratio liquid assets I current liabilities Operating Cash Flow Ratio cash flow from operations / current liabilities 0.07 0.39 0.44 0462 0.53 0.65 0.73 0.08 0.80 0107 0.69 0.42 0.81 0.34 0.40 0.40 0.00 NIA NA 71.18 77.25 74 34 73.82 75.41 118,00 42.60 NA NA 5.13 4.73 491 4.94 4.84 3.09 ACTIVITY RATIOS: Receivables Turnover net sales / net ending receivables Days Outstanding in Accounts Receivable 365 days / receivables tumover Inventory Turnover cost of sales /inventory Days of Inventory on Hand 365 / (cost of sales/inventory) -1.74 14.10 -1101 3.43 427 4.48 447 499 3.87 -1.12 620 -233 106.41 85.51 81.40 81.72 69.22 94.99 25.78 58.70 3629 44 95% 44.9196 44 89% 42 51% 42.49% 43.90% 1.41% 38 809 5.10% 234% 3.61% 3.64% 237% 3.02% 4.26% 1.24% 330% PROFITABILITY / PERFORMANCE RATIOS: Gross Profit Percentage gross profit/ net sales Profit Margin net income / net sales Return on Assets net income / total assets Return on Equity net income / total owners' equity 14 80% 6.8496 10.53% 6.83% 4.69% 11.17% 6.4896 3.7795 26.43% 16.22% 12.86% 11.0396 5.9295 16.70% 10.79% -0.00% 17509 -0.34 0.79 0.88 0.58 0.61 0.50 -0.01 0.84 0.51 COVERAGE RATIOS: Debt to Equity total liabilities / shareholders' investment Times Interest Earned (net income + interest expense) / interest expense NA 50.57 40:38 NA 53.88 26.31 26.41 23.92 10.19 * Expected values are obtained by using the forecast function in Excel (using the row of data from 2015 and 2018 to obtain the expected value for 2019) t Industry Source: Dun & Bradstreet (D&B). The median values of the industry ratios are used for comparison purposes. For ratios not speafically induded on D&B, ratios were calculated from average financial statement data provided N/A=not available or could not be calculated from financial data B D E F EARTHWEAR CLOTHIERS Preliminary Analytical Procedures Summary of Ratio Analyses & Assessment of Financial Condition December 31, 2019 G H 5-2 fim 11/2/2021 1. Comments and Summary Based on your review of work paper 5-1. listone or two raios in each of the following categories that you believe increase the risk of potential misstatement Explain why you believe the risk is increased and identify possible causes of a potential For example, "Days of Inventory on Hand increased significantly indicating merchandise is held in inventory for a longer period than prior years and it is also held for a longer period than the industry average. This increases the risk of SHORT-TERM LIQUIDITY RATIOS: 2017 & 2019 ratios for current assets looks positive but the quick rato gives way to concern of some cash flow issues ACTIVITY RATIOS: Product is readily available and moves rapidly PROFITABILITY / PERFORMANCE RATIOS: The company is comprable to its competitors and outperforms is competitors showing great profitability for the company COVERAGE RATIOS: Enter your response here. (This cell will expand automatically your responseHuse ALT+ENTER to begin a new line 2. Assessment of Financial Position Based on your review of work paper 5-1. assess the client's ability to continue as a going concern (to stay in business) by responding to the following questions A. Identify ratios and trends, if any, that cause concern about the client's ability to continue as a going concern Enter your response here (This cell will expand automatically to your response - use ALT+ENTER to begin a new line) B. Identify ratios and trends, if any, that indicate a high likelihood that the client will continue successfully as a going concern Enter your response here (This cell will expand automatically to your response - use ALTHENTER to begin a new line) C. Assess the client's financial condition as one of the following (select one from the drop down list in cell B35) High probability that the company will successfully continue in business for at least one year and be able to pay its debts as they become due Moderate possibility that the company will NOT successfully continue in business for at least one year and be able to pay its debts as they become High probability that the company will NOT successfully continue in business for at least one year and be able to pay its debts as they become due D. Briefly explain the reasoning behind your assessment Enter your response here (This cel will expand automatically to fit your response Huse ALT ENTER to begin a new line) D Common Skecome Statement Work Paper 5-3 Common Size Balance Sheet G H J K December 31 M N 2017 Dollar Value % of Total Assets 2018 Dollar Value % of Total Assets Expected" Dollar Value % of Total Assets 2019 Actual Dollar Value 96 of Total Assets Difference Dolar Value % of Total Assets 16.7596 $49,668 $11,539 $105 425 $10.772 $3.780 $6.930 $188/115 $48,288 $14,211 $139,249 20.38% 2.22% 3,89% 35.55% 3.63% 1.2796 2.34% 634496 $48,978 $12.875 $122 337 $11.458 $6,315 $7 132 $209.095 14.84% 3.90% 37.08% 3.47% 1.91% 2.16% 63.379 37.93% $12,143 $8,849 S7 335 $230,075 13.29% 3.91% 38.32% 3.34% 2.44% 2.02% 63.31% $79,359 $8,643 $147,693 $10,212 $5,435 $10.338 $261,680 2.62% 1.40% 265% 67.20% $31.071 (55,568) $8.444 ($1,932 ($3,414) $3,003 $31,604 $66.804 $66,876 2894 $184,040 $76.256 $107 784 $628 $296,527 22.539 22.5596 16.01% 0.98% 62.07% 25.7296 36,65% 0.21% 700.00% Assets 0 Current Assets: Cash and cash equivalents Receivables, net Inventory 1 Prepaid advertising Other prepaid expenses Defemed income tax benefits Total current assets Property, plant and equipment, at cost Land and buildings D Fixtures and equipment 1 Computer hardware and software Leasehold improvements 3 Total property, plant and equipment Less - accumulated depreciation and amortization Property, plant and equipment, net Intangibles, net Total assets B Liabilities and shareholder's investment Current liabilities: Lines of credit Accounts payable Reserve for retums Accrued liabilities Accrued profit sharing Income taxes payable Total current liabilities Deferred income taxes Shareholders' investment Common stock, 26.144 shares issued Donated capital Additional paid-in capital Deferred compensation Accumulated other comprehensive income Retained eamings Treasury stock, 6,654,7,114, and 6,546 shares at cost, respectively Total shareholders investment 3 Tota labies and shareholders investment 7.09% -1.69% -0.39% -0.7296 -10496 0.649 3.68% 0.00% -9.99% -1.13% 3.349 -0.05% -551% -1.25% $70,918 $67513 $64.986 $3,010 $206,426 $85,986 $120.440 $423 $329,959 21.49% 20.46% 19.70% 0.91% 62.56% 26.06% 36.5096 0.13% 100.009 $75,031 $68,150 $82.507 $3,125 $228,812 $95.716 15733,097 $218 $363.3907 20.65% 18.75% 22.70% 0.86% 62.97% 26.34% 36.63% 0.06% 100.00% $76,560 $68,632 $75.400 $3,144 $273.737 $97,722 $126,014 $1,734 $389,428 19.66% 17.62% 19.36% 0.81% 57.45% 25.09% 32 36% 0.45% 100.00% $1,529 $482 (57,107) $20 ($5,075) $2007 $1,516 $26,038 0.39% 0.00% -125% 7.15% -0.27% $7,621 $48.432 $5,115 $28.440 $1,794 56.666 $98.067 2.57% 16.33% 1.7296 9.5996 0.6196 2.2596 33.07% 2.00% $11,011 562.509 $5,890 $26.738 $1,532 $8,588 $116,268 $9.469 3.34% 18.94% 1.78% 8.10% 0.46% 2.60% 35.24% 2.87% $14,401 $76,587 $6,664 $25,035 $1,270 $10,511 $734,469 $13,011 3.96% 21.08% 1,83% 6.89% 0.35% 2.89% 37.00% 3.58% $10,510 $54,186 $6,100 $30,492 $3,108 $16,222 $120,617 $8,345 270% 13.91% 1575 7.83% 0.80% 4.17% 30.97% 2.14% 53.892 $22.401) (SSED) 55456 51.838 $5711 ($13.853) $4,566) 12% $5,926 -1.44% $261 $5.460 $19.311 ($153) $1,739 $295.380 ($129,462) $192.535 $295,527 0.09% 184% 6.51% -0.05% 0.5996 99.6196 43.66% 64.9396 100.00% $261 $5,460 $20.740 ($79 $3,883 $317 907 ($143,950) $204,222 $329,959 0.08% 1.6596 6.29% -0.029 1.18% 96.35% 43.63% 61,89% 700.0098 $261 $5,460 $22,170 (94) $6,027 $340,434 ($158.438) $215,910 $363.390 0.07% 150% 6.10% 0.00% 1.66% 93.68% 43.60% 59.4296 100.00% $261 $5,460 $25,719 ($36) $2.173 $361,402 ($134,512) $260,467 $389.428 2.07% 1.40% 6.60% 0.01% 0.56% 92.80% 34.54% 66.88% 100.00% $0 SO $3,550 $35) $3,855) $20.968 $23.925 544557 525038 0.00% -10% 0.50% -0.01% -1.10% -0.88% 9.06% 74796 0.00% * Expected values are obtained by using the forecast function in Excel (using the row of data from 2017 and 2018 to obtain the expected value for 2019) 1 wiarl Paner 5-1 Work Paper 5-2 Work Paper 5-3 Common Size Balance Sheet Common Size Income Statement G H J K M EARTHWEAR CLOTHIERS Common-size Statements of Operations (In thousands, except per share data) 5-5 S4A 1/3/2020 For the period ended December 31 2018 Dollar Value 950.484 546,393 404,091 364,012 40,729 2017 Dollar Value % of Sales 857,885 100.00% 472.739 55.11% 385,146 44.89% 334.994 39.05% (1,153) -0.13% 51,305 5.98% 0.00% (1 229) -0.14% 573 0.07% 0.00% (1.091) -0.13% (1.747 -0.20% 49,559 5.78% 18,337 2.14% 31 222 3.64% 1.60 1.56 19,555 20,055 D Net Sales Cost of sales Gross Profit 8 Selling, general and administrative expenses Non-recurring charge (credit) 5 Income from operations 5 Other income (expense) Interest expense Interest income Gain on sale of subsidiary Other Total other income expense), net Income before income taxes Income tax provision Net income Basic earnings per share Diluted earnings per share Basic weighted average shares outstanding Diluted weighted average shares outstanding % of Sales 100.00% 57.49% 42.51% 38,30% 0.00% 4.29% 0.00% -0.10% 0.15% 0.00% -0.50% -1.45% 3.76% 1.39% 2.37% (983) 1,459 -0.07% Expected Dollar Value % of Sales 1.043,083 100.00% 620.046 59.44% 423,037 40.56% 393,031 37.68% 0.00% 46,050 4.41% 0.00% (737) 1,017 0.10% 0.00% (2,947) -0.28% 3,037) -0.29% 42,688 4.09% 15,794 1.51% 26,894 2.58% 1.38 1.35 19,558 19,930 2019 Actual Dollar Value % of Sales 1,019,890 100.00% 572,153 56.10% 447.737 43.90% 374,180 36.69% 0.00% 73,557 7 21% 0.00% (878) -0.09% 989 0.10% 0.00% 3,514) -0.34% (3.403) -0.33% 70,154 6.88% 26.658 261% 43.495 4.26% 1:48 1.45 19.159 19,485 Difference Dollar Value % of Sales (23.193) 0.00% (47 893) -3.34% 24.700 3.34% (18,851) -0.99% 0 0.00% 27 506 2 80% 0 0.00% (140) -0.02% (28) 0.0096 0 0.00% (567) -0.06% (366) -0.04% 27.466 279% 10,864 1.10% 16,602 1 69% Q.10 0.10 (398) (445) (4.798) (4,322) 35,757 13.230 22.527 1.15 1.14 19,531 19.774 *Expected values are obtained by using the forecast function in Excel (using the row of data from 2017 and 2018 to obtain the expected value for 2019) @ The McGraw-Hill Companies, Inc., 2019 EARTHWEAR CLOTHIERS Ratio Analyses December 31, 2019 December 31 2015 2016 2017 2018 2019 2019 (Audited) (Audited) (Audited) (Audited) Expected" Actual (unaudited) 511 SAH 1/3/2020 Difference from Expected Industry Difference Average (from 2019) 1.64 1.43 1.92 1.80 1.94 2.17 0.23 2.10 SHORT-TERM LIQUIDITY RATIOS: Current Ratio current assets/ current liabilities Quick Ratio liquid assets I current liabilities Operating Cash Flow Ratio cash flow from operations / current liabilities 0.07 0.39 0.44 0462 0.53 0.65 0.73 0.08 0.80 0107 0.69 0.42 0.81 0.34 0.40 0.40 0.00 NIA NA 71.18 77.25 74 34 73.82 75.41 118,00 42.60 NA NA 5.13 4.73 491 4.94 4.84 3.09 ACTIVITY RATIOS: Receivables Turnover net sales / net ending receivables Days Outstanding in Accounts Receivable 365 days / receivables tumover Inventory Turnover cost of sales /inventory Days of Inventory on Hand 365 / (cost of sales/inventory) -1.74 14.10 -1101 3.43 427 4.48 447 499 3.87 -1.12 620 -233 106.41 85.51 81.40 81.72 69.22 94.99 25.78 58.70 3629 44 95% 44.9196 44 89% 42 51% 42.49% 43.90% 1.41% 38 809 5.10% 234% 3.61% 3.64% 237% 3.02% 4.26% 1.24% 330% PROFITABILITY / PERFORMANCE RATIOS: Gross Profit Percentage gross profit/ net sales Profit Margin net income / net sales Return on Assets net income / total assets Return on Equity net income / total owners' equity 14 80% 6.8496 10.53% 6.83% 4.69% 11.17% 6.4896 3.7795 26.43% 16.22% 12.86% 11.0396 5.9295 16.70% 10.79% -0.00% 17509 -0.34 0.79 0.88 0.58 0.61 0.50 -0.01 0.84 0.51 COVERAGE RATIOS: Debt to Equity total liabilities / shareholders' investment Times Interest Earned (net income + interest expense) / interest expense NA 50.57 40:38 NA 53.88 26.31 26.41 23.92 10.19 * Expected values are obtained by using the forecast function in Excel (using the row of data from 2015 and 2018 to obtain the expected value for 2019) t Industry Source: Dun & Bradstreet (D&B). The median values of the industry ratios are used for comparison purposes. For ratios not speafically induded on D&B, ratios were calculated from average financial statement data provided N/A=not available or could not be calculated from financial data B D E F EARTHWEAR CLOTHIERS Preliminary Analytical Procedures Summary of Ratio Analyses & Assessment of Financial Condition December 31, 2019 G H 5-2 fim 11/2/2021 1. Comments and Summary Based on your review of work paper 5-1. listone or two raios in each of the following categories that you believe increase the risk of potential misstatement Explain why you believe the risk is increased and identify possible causes of a potential For example, "Days of Inventory on Hand increased significantly indicating merchandise is held in inventory for a longer period than prior years and it is also held for a longer period than the industry average. This increases the risk of SHORT-TERM LIQUIDITY RATIOS: 2017 & 2019 ratios for current assets looks positive but the quick rato gives way to concern of some cash flow issues ACTIVITY RATIOS: Product is readily available and moves rapidly PROFITABILITY / PERFORMANCE RATIOS: The company is comprable to its competitors and outperforms is competitors showing great profitability for the company COVERAGE RATIOS: Enter your response here. (This cell will expand automatically your responseHuse ALT+ENTER to begin a new line 2. Assessment of Financial Position Based on your review of work paper 5-1. assess the client's ability to continue as a going concern (to stay in business) by responding to the following questions A. Identify ratios and trends, if any, that cause concern about the client's ability to continue as a going concern Enter your response here (This cell will expand automatically to your response - use ALT+ENTER to begin a new line) B. Identify ratios and trends, if any, that indicate a high likelihood that the client will continue successfully as a going concern Enter your response here (This cell will expand automatically to your response - use ALTHENTER to begin a new line) C. Assess the client's financial condition as one of the following (select one from the drop down list in cell B35) High probability that the company will successfully continue in business for at least one year and be able to pay its debts as they become due Moderate possibility that the company will NOT successfully continue in business for at least one year and be able to pay its debts as they become High probability that the company will NOT successfully continue in business for at least one year and be able to pay its debts as they become due D. Briefly explain the reasoning behind your assessment Enter your response here (This cel will expand automatically to fit your response Huse ALT ENTER to begin a new line) D Common Skecome Statement Work Paper 5-3 Common Size Balance Sheet G H J K December 31 M N 2017 Dollar Value % of Total Assets 2018 Dollar Value % of Total Assets Expected" Dollar Value % of Total Assets 2019 Actual Dollar Value 96 of Total Assets Difference Dolar Value % of Total Assets 16.7596 $49,668 $11,539 $105 425 $10.772 $3.780 $6.930 $188/115 $48,288 $14,211 $139,249 20.38% 2.22% 3,89% 35.55% 3.63% 1.2796 2.34% 634496 $48,978 $12.875 $122 337 $11.458 $6,315 $7 132 $209.095 14.84% 3.90% 37.08% 3.47% 1.91% 2.16% 63.379 37.93% $12,143 $8,849 S7 335 $230,075 13.29% 3.91% 38.32% 3.34% 2.44% 2.02% 63.31% $79,359 $8,643 $147,693 $10,212 $5,435 $10.338 $261,680 2.62% 1.40% 265% 67.20% $31.071 (55,568) $8.444 ($1,932 ($3,414) $3,003 $31,604 $66.804 $66,876 2894 $184,040 $76.256 $107 784 $628 $296,527 22.539 22.5596 16.01% 0.98% 62.07% 25.7296 36,65% 0.21% 700.00% Assets 0 Current Assets: Cash and cash equivalents Receivables, net Inventory 1 Prepaid advertising Other prepaid expenses Defemed income tax benefits Total current assets Property, plant and equipment, at cost Land and buildings D Fixtures and equipment 1 Computer hardware and software Leasehold improvements 3 Total property, plant and equipment Less - accumulated depreciation and amortization Property, plant and equipment, net Intangibles, net Total assets B Liabilities and shareholder's investment Current liabilities: Lines of credit Accounts payable Reserve for retums Accrued liabilities Accrued profit sharing Income taxes payable Total current liabilities Deferred income taxes Shareholders' investment Common stock, 26.144 shares issued Donated capital Additional paid-in capital Deferred compensation Accumulated other comprehensive income Retained eamings Treasury stock, 6,654,7,114, and 6,546 shares at cost, respectively Total shareholders investment 3 Tota labies and shareholders investment 7.09% -1.69% -0.39% -0.7296 -10496 0.649 3.68% 0.00% -9.99% -1.13% 3.349 -0.05% -551% -1.25% $70,918 $67513 $64.986 $3,010 $206,426 $85,986 $120.440 $423 $329,959 21.49% 20.46% 19.70% 0.91% 62.56% 26.06% 36.5096 0.13% 100.009 $75,031 $68,150 $82.507 $3,125 $228,812 $95.716 15733,097 $218 $363.3907 20.65% 18.75% 22.70% 0.86% 62.97% 26.34% 36.63% 0.06% 100.00% $76,560 $68,632 $75.400 $3,144 $273.737 $97,722 $126,014 $1,734 $389,428 19.66% 17.62% 19.36% 0.81% 57.45% 25.09% 32 36% 0.45% 100.00% $1,529 $482 (57,107) $20 ($5,075) $2007 $1,516 $26,038 0.39% 0.00% -125% 7.15% -0.27% $7,621 $48.432 $5,115 $28.440 $1,794 56.666 $98.067 2.57% 16.33% 1.7296 9.5996 0.6196 2.2596 33.07% 2.00% $11,011 562.509 $5,890 $26.738 $1,532 $8,588 $116,268 $9.469 3.34% 18.94% 1.78% 8.10% 0.46% 2.60% 35.24% 2.87% $14,401 $76,587 $6,664 $25,035 $1,270 $10,511 $734,469 $13,011 3.96% 21.08% 1,83% 6.89% 0.35% 2.89% 37.00% 3.58% $10,510 $54,186 $6,100 $30,492 $3,108 $16,222 $120,617 $8,345 270% 13.91% 1575 7.83% 0.80% 4.17% 30.97% 2.14% 53.892 $22.401) (SSED) 55456 51.838 $5711 ($13.853) $4,566) 12% $5,926 -1.44% $261 $5.460 $19.311 ($153) $1,739 $295.380 ($129,462) $192.535 $295,527 0.09% 184% 6.51% -0.05% 0.5996 99.6196 43.66% 64.9396 100.00% $261 $5,460 $20.740 ($79 $3,883 $317 907 ($143,950) $204,222 $329,959 0.08% 1.6596 6.29% -0.029 1.18% 96.35% 43.63% 61,89% 700.0098 $261 $5,460 $22,170 (94) $6,027 $340,434 ($158.438) $215,910 $363.390 0.07% 150% 6.10% 0.00% 1.66% 93.68% 43.60% 59.4296 100.00% $261 $5,460 $25,719 ($36) $2.173 $361,402 ($134,512) $260,467 $389.428 2.07% 1.40% 6.60% 0.01% 0.56% 92.80% 34.54% 66.88% 100.00% $0 SO $3,550 $35) $3,855) $20.968 $23.925 544557 525038 0.00% -10% 0.50% -0.01% -1.10% -0.88% 9.06% 74796 0.00% * Expected values are obtained by using the forecast function in Excel (using the row of data from 2017 and 2018 to obtain the expected value for 2019) 1 wiarl Paner 5-1 Work Paper 5-2 Work Paper 5-3 Common Size Balance Sheet Common Size Income Statement G H J K M EARTHWEAR CLOTHIERS Common-size Statements of Operations (In thousands, except per share data) 5-5 S4A 1/3/2020 For the period ended December 31 2018 Dollar Value 950.484 546,393 404,091 364,012 40,729 2017 Dollar Value % of Sales 857,885 100.00% 472.739 55.11% 385,146 44.89% 334.994 39.05% (1,153) -0.13% 51,305 5.98% 0.00% (1 229) -0.14% 573 0.07% 0.00% (1.091) -0.13% (1.747 -0.20% 49,559 5.78% 18,337 2.14% 31 222 3.64% 1.60 1.56 19,555 20,055 D Net Sales Cost of sales Gross Profit 8 Selling, general and administrative expenses Non-recurring charge (credit) 5 Income from operations 5 Other income (expense) Interest expense Interest income Gain on sale of subsidiary Other Total other income expense), net Income before income taxes Income tax provision Net income Basic earnings per share Diluted earnings per share Basic weighted average shares outstanding Diluted weighted average shares outstanding % of Sales 100.00% 57.49% 42.51% 38,30% 0.00% 4.29% 0.00% -0.10% 0.15% 0.00% -0.50% -1.45% 3.76% 1.39% 2.37% (983) 1,459 -0.07% Expected Dollar Value % of Sales 1.043,083 100.00% 620.046 59.44% 423,037 40.56% 393,031 37.68% 0.00% 46,050 4.41% 0.00% (737) 1,017 0.10% 0.00% (2,947) -0.28% 3,037) -0.29% 42,688 4.09% 15,794 1.51% 26,894 2.58% 1.38 1.35 19,558 19,930 2019 Actual Dollar Value % of Sales 1,019,890 100.00% 572,153 56.10% 447.737 43.90% 374,180 36.69% 0.00% 73,557 7 21% 0.00% (878) -0.09% 989 0.10% 0.00% 3,514) -0.34% (3.403) -0.33% 70,154 6.88% 26.658 261% 43.495 4.26% 1:48 1.45 19.159 19,485 Difference Dollar Value % of Sales (23.193) 0.00% (47 893) -3.34% 24.700 3.34% (18,851) -0.99% 0 0.00% 27 506 2 80% 0 0.00% (140) -0.02% (28) 0.0096 0 0.00% (567) -0.06% (366) -0.04% 27.466 279% 10,864 1.10% 16,602 1 69% Q.10 0.10 (398) (445) (4.798) (4,322) 35,757 13.230 22.527 1.15 1.14 19,531 19.774 *Expected values are obtained by using the forecast function in Excel (using the row of data from 2017 and 2018 to obtain the expected value for 2019) @ The McGraw-Hill Companies, Inc., 2019
Step by Step Solution
There are 3 Steps involved in it
Step: 1

Get Instant Access to Expert-Tailored Solutions
See step-by-step solutions with expert insights and AI powered tools for academic success
Step: 2

Step: 3
Ace Your Homework with AI
Get the answers you need in no time with our AI-driven, step-by-step assistance
Get Started
Acca F7 Financial Reporting Practice And Revision Kit
Authors: BPP Learning Media
1st Edition
1472726898, 978-1472726896