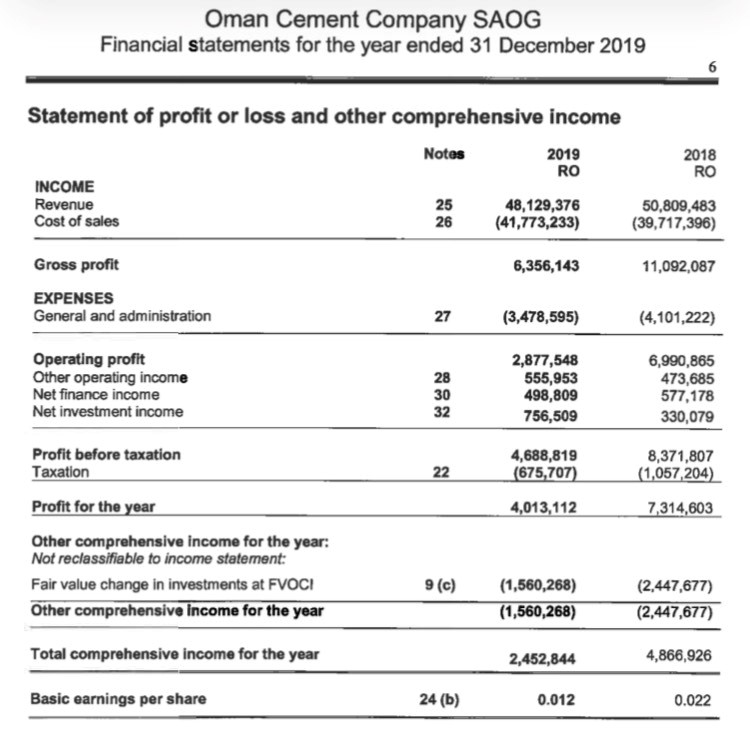
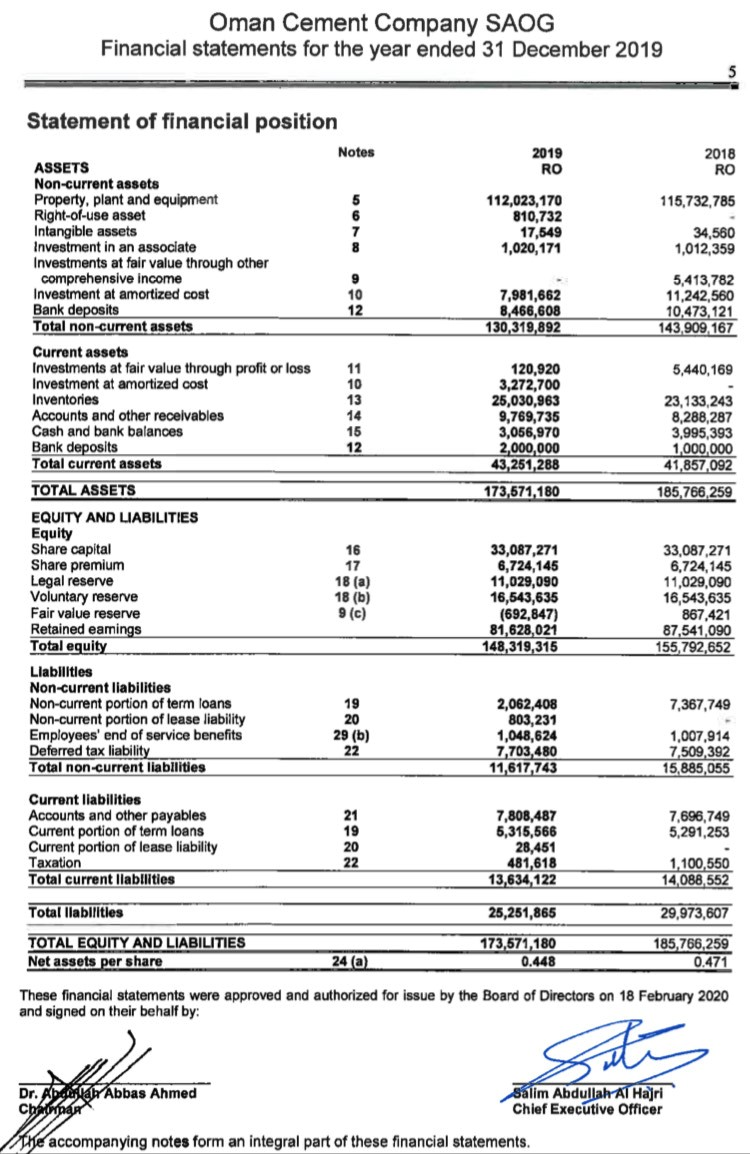
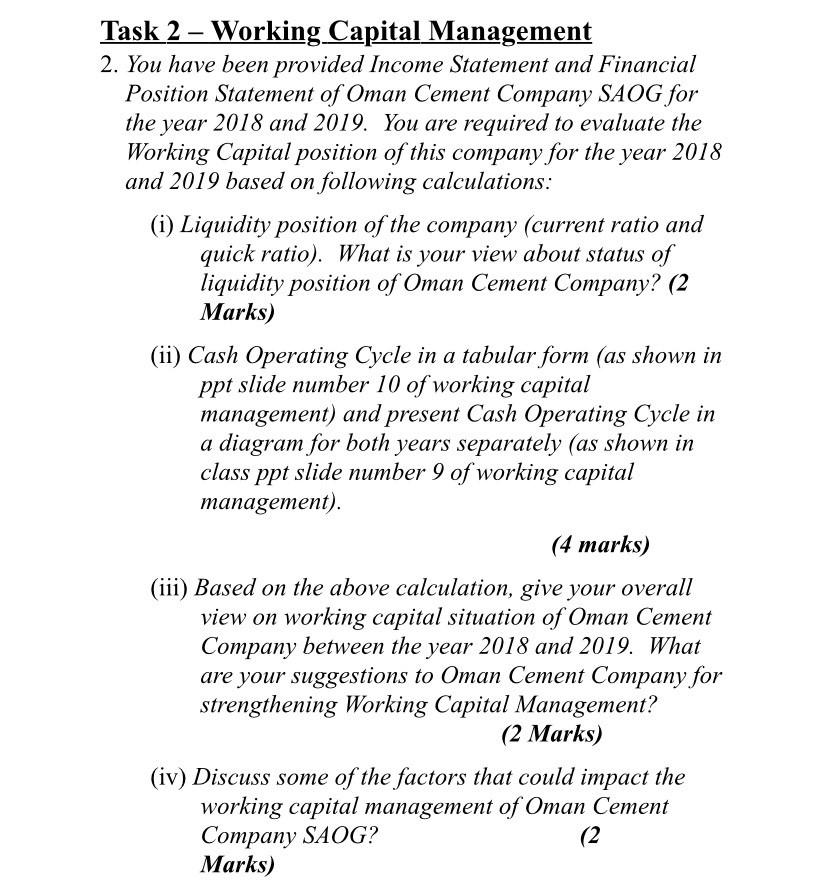
Oman Cement Company SAOG Financial statements for the year ended 31 December 2019 6 Statement of profit or loss and other comprehensive income Notes 2019 RO INCOME Revenue 48,129,376 Cost of sales 26 (41,773,233) 2018 RO 25 50,809,483 (39,717,396) 6,356,143 11,092,087 Gross profit EXPENSES General and administration 27 (3,478,595) (4,101,222) Operating profit Other operating income Net finance income Net investment income 28 30 32 2,877,548 555,953 498,809 756,509 6,990,865 473,685 577,178 330,079 Profit before taxation Taxation 22 4,688,819 (675,707) 8,371,807 (1,057 204) 4,013,112 7,314,603 Profit for the year Other comprehensive income for the year: Not reclassifiable to income statement: Fair value change in investments at FVOCI Other comprehensive income for the year 9 (c) (1,560,268) (1,560,268) (2,447,677) (2,447,677) Total comprehensive income for the year 2,452,844 4,866,926 Basic earnings per share 24 (b) 0.012 0.022 Oman Cement Company SAOG Financial statements for the year ended 31 December 2019 5 Statement of financial position Notes 2019 RO 2018 RO 115,732,785 6 112,023,170 810,732 17,649 1,020,171 34,560 1,012,359 9 10 12 7,981,662 8,466,608 130,319,892 5,413,782 11,242,560 10,473,121 143,909, 167 5,440,169 11 10 13 14 15 12 ASSETS Non-current assets Property, plant and equipment Right-of-use asset Intangible assets Investment in an associate Investments at fair value through other comprehensive income Investment at amortized cost Bank deposits Total non-current assets Current assets Investments at fair value through profit or loss Investment at amortized cost Inventories Accounts and other receivables Cash and bank balances Bank deposits Total current assets TOTAL ASSETS EQUITY AND LIABILITIES Equity Share capital Share premium Legal reserve Voluntary reserve Fair value reserve Retained earings Total equity Llabilities Non-current liabilities Non-current portion of term loans Non-current portion of lease liability Employees' end of service benefits Deferred tax liability Total non-current liabilities 120,920 3,272,700 25,030,963 9,769,735 3,056,970 2,000,000 43,251,288 173,571,180 23,133,243 8,288,287 3,995,393 1,000,000 41,857,092 185,766,259 16 17 18 (a) 18 (b) 9 (c) 33,087,271 6,724,145 11,029,090 16,543,635 (692,847) 81,628,021 148,319,315 33,087,271 6,724,145 11,029,090 16,543,635 867,421 87,541,090 155,792,652 7,367,749 19 20 29 (b) 22 2,062,408 803,231 1,048,624 7, 703,480 11,617 743 1,007,914 7,509,392 15,885,055 Current liabilities Accounts and other payables Current portion of term loans Current portion of lease liability Taxation Total current liabilities 21 19 20 22 7,696,749 5,291,253 7,808,487 5,315,566 28,451 481,618 13,634, 122 1,100,550 14,088,552 Total liabilities 25,251,865 29,973,607 TOTAL EQUITY AND LIABILITIES Net assets per share 173,671 180 0.448 185,766,259 0.471 24 (a) These financial statements were approved and authorized for issue by the Board of Directors on 18 February 2020 and signed on their behalf by: Sites Dr. Abdullah Abbas Ahmed Chroma Salim Abdullah Al Hajri Chief Executive Officer the accompanying notes form an integral part of these financial statements. Task 2 Working Capital Management 2. You have been provided Income Statement and Financial Position Statement of Oman Cement Company SAOG for the year 2018 and 2019. You are required to evaluate the Working Capital position of this company for the year 2018 and 2019 based on following calculations: (i) Liquidity position of the company (current ratio and quick ratio). What is your view about status of liquidity position of Oman Cement Company? (2 Marks) (ii) Cash Operating Cycle in a tabular form (as shown in ppt slide number 10 of working capital management) and present Cash Operating Cycle in a diagram for both years separately (as shown in class ppt slide number 9 of working capital management). (4 marks) (iii) Based on the above calculation, give your overall view on working capital situation of Oman Cement Company between the year 2018 and 2019. What are your suggestions to Oman Cement Company for strengthening Working Capital Management? (2 Marks) (iv) Discuss some of the factors that could impact the working capital management of Oman Cement Company SOG? (2 Marks) Oman Cement Company SAOG Financial statements for the year ended 31 December 2019 6 Statement of profit or loss and other comprehensive income Notes 2019 RO INCOME Revenue 48,129,376 Cost of sales 26 (41,773,233) 2018 RO 25 50,809,483 (39,717,396) 6,356,143 11,092,087 Gross profit EXPENSES General and administration 27 (3,478,595) (4,101,222) Operating profit Other operating income Net finance income Net investment income 28 30 32 2,877,548 555,953 498,809 756,509 6,990,865 473,685 577,178 330,079 Profit before taxation Taxation 22 4,688,819 (675,707) 8,371,807 (1,057 204) 4,013,112 7,314,603 Profit for the year Other comprehensive income for the year: Not reclassifiable to income statement: Fair value change in investments at FVOCI Other comprehensive income for the year 9 (c) (1,560,268) (1,560,268) (2,447,677) (2,447,677) Total comprehensive income for the year 2,452,844 4,866,926 Basic earnings per share 24 (b) 0.012 0.022 Oman Cement Company SAOG Financial statements for the year ended 31 December 2019 5 Statement of financial position Notes 2019 RO 2018 RO 115,732,785 6 112,023,170 810,732 17,649 1,020,171 34,560 1,012,359 9 10 12 7,981,662 8,466,608 130,319,892 5,413,782 11,242,560 10,473,121 143,909, 167 5,440,169 11 10 13 14 15 12 ASSETS Non-current assets Property, plant and equipment Right-of-use asset Intangible assets Investment in an associate Investments at fair value through other comprehensive income Investment at amortized cost Bank deposits Total non-current assets Current assets Investments at fair value through profit or loss Investment at amortized cost Inventories Accounts and other receivables Cash and bank balances Bank deposits Total current assets TOTAL ASSETS EQUITY AND LIABILITIES Equity Share capital Share premium Legal reserve Voluntary reserve Fair value reserve Retained earings Total equity Llabilities Non-current liabilities Non-current portion of term loans Non-current portion of lease liability Employees' end of service benefits Deferred tax liability Total non-current liabilities 120,920 3,272,700 25,030,963 9,769,735 3,056,970 2,000,000 43,251,288 173,571,180 23,133,243 8,288,287 3,995,393 1,000,000 41,857,092 185,766,259 16 17 18 (a) 18 (b) 9 (c) 33,087,271 6,724,145 11,029,090 16,543,635 (692,847) 81,628,021 148,319,315 33,087,271 6,724,145 11,029,090 16,543,635 867,421 87,541,090 155,792,652 7,367,749 19 20 29 (b) 22 2,062,408 803,231 1,048,624 7, 703,480 11,617 743 1,007,914 7,509,392 15,885,055 Current liabilities Accounts and other payables Current portion of term loans Current portion of lease liability Taxation Total current liabilities 21 19 20 22 7,696,749 5,291,253 7,808,487 5,315,566 28,451 481,618 13,634, 122 1,100,550 14,088,552 Total liabilities 25,251,865 29,973,607 TOTAL EQUITY AND LIABILITIES Net assets per share 173,671 180 0.448 185,766,259 0.471 24 (a) These financial statements were approved and authorized for issue by the Board of Directors on 18 February 2020 and signed on their behalf by: Sites Dr. Abdullah Abbas Ahmed Chroma Salim Abdullah Al Hajri Chief Executive Officer the accompanying notes form an integral part of these financial statements. Task 2 Working Capital Management 2. You have been provided Income Statement and Financial Position Statement of Oman Cement Company SAOG for the year 2018 and 2019. You are required to evaluate the Working Capital position of this company for the year 2018 and 2019 based on following calculations: (i) Liquidity position of the company (current ratio and quick ratio). What is your view about status of liquidity position of Oman Cement Company? (2 Marks) (ii) Cash Operating Cycle in a tabular form (as shown in ppt slide number 10 of working capital management) and present Cash Operating Cycle in a diagram for both years separately (as shown in class ppt slide number 9 of working capital management). (4 marks) (iii) Based on the above calculation, give your overall view on working capital situation of Oman Cement Company between the year 2018 and 2019. What are your suggestions to Oman Cement Company for strengthening Working Capital Management? (2 Marks) (iv) Discuss some of the factors that could impact the working capital management of Oman Cement Company SOG? (2 Marks)