Answered step by step
Verified Expert Solution
Question
1 Approved Answer
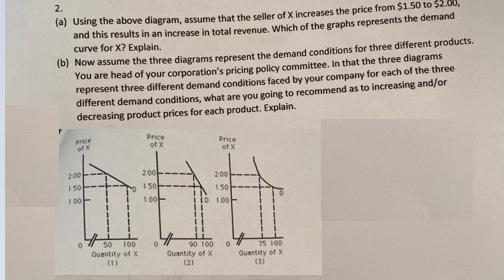
2. (a) Using the above diagram, assume that the seller of X increases the price from $1.50 to $2.00, and this results in an

2. (a) Using the above diagram, assume that the seller of X increases the price from $1.50 to $2.00, and this results in an increase in total revenue, Which of the graphs represents the demand curve for X? Explain. (6) Now assume the three diagrams represent the demand conditions for three different products. You are head of your corporation's pricing policy committee. in that the three diagrams represent three different demand conditions faced by your company for each of the three different demand conditions, what are you going to recommend as to increasing and/or decreasing product prices for each product. Explain. Price ofx prce Drice of X of X 200 I 50 200-- 200 150 150-- 100- 1D 100- 50 100 90 100 75 100 Ouantity of X (31 Ouantity of X Quantity of X (2)
Step by Step Solution
★★★★★
3.54 Rating (157 Votes )
There are 3 Steps involved in it
Step: 1

Get Instant Access to Expert-Tailored Solutions
See step-by-step solutions with expert insights and AI powered tools for academic success
Step: 2

Step: 3

Ace Your Homework with AI
Get the answers you need in no time with our AI-driven, step-by-step assistance
Get Started


