Question
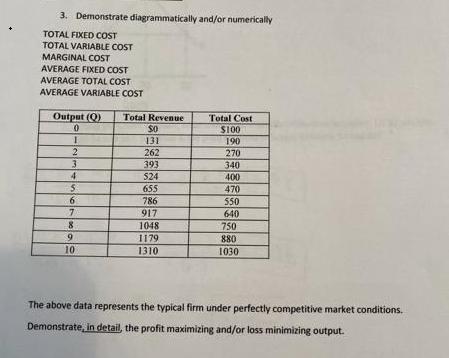
3. Demonstrate diagrammatically and/or numerically TOTAL FIXED COST TOTAL VARIABLE COST MARGINAL COST AVERAGE FIXED COST AVERAGE TOTAL COST AVERAGE VARIABLE COST Output (Q)

3. Demonstrate diagrammatically and/or numerically TOTAL FIXED COST TOTAL VARIABLE COST MARGINAL COST AVERAGE FIXED COST AVERAGE TOTAL COST AVERAGE VARIABLE COST Output (Q) Total Revenue S0 Total Cost S100 190 270 131 2 262 393 3. 340 400 470 4. 524 655 6. 786 550 7 917 1048 1179 640 750 880 1030 10 1310 The above data represents the typical firm under perfectly competitive market conditions. Demonstrate, in detail, the profit maximizing and/or loss minimizing output.
Step by Step Solution
3.34 Rating (151 Votes )
There are 3 Steps involved in it
Step: 1
out ulative Put out Put O O 2 3 4 5 6 7 8 Cum Total Fixed cost cost 10 0 1 190 3 6 100 ...
Get Instant Access to Expert-Tailored Solutions
See step-by-step solutions with expert insights and AI powered tools for academic success
Step: 2

Step: 3

Ace Your Homework with AI
Get the answers you need in no time with our AI-driven, step-by-step assistance
Get StartedRecommended Textbook for
Managerial Economics Foundations of Business Analysis and Strategy
Authors: Christopher Thomas, S. Charles Maurice
11th edition
978-0078021718
Students also viewed these Economics questions
Question
Answered: 1 week ago
Question
Answered: 1 week ago
Question
Answered: 1 week ago
Question
Answered: 1 week ago
Question
Answered: 1 week ago
Question
Answered: 1 week ago
Question
Answered: 1 week ago
Question
Answered: 1 week ago
Question
Answered: 1 week ago
Question
Answered: 1 week ago
Question
Answered: 1 week ago
Question
Answered: 1 week ago
Question
Answered: 1 week ago
Question
Answered: 1 week ago
Question
Answered: 1 week ago
Question
Answered: 1 week ago
Question
Answered: 1 week ago
Question
Answered: 1 week ago
Question
Answered: 1 week ago
Question
Answered: 1 week ago
Question
Answered: 1 week ago
Question
Answered: 1 week ago
View Answer in SolutionInn App


