

Answered step by step
Verified Expert Solution
Question
1 Approved Answer
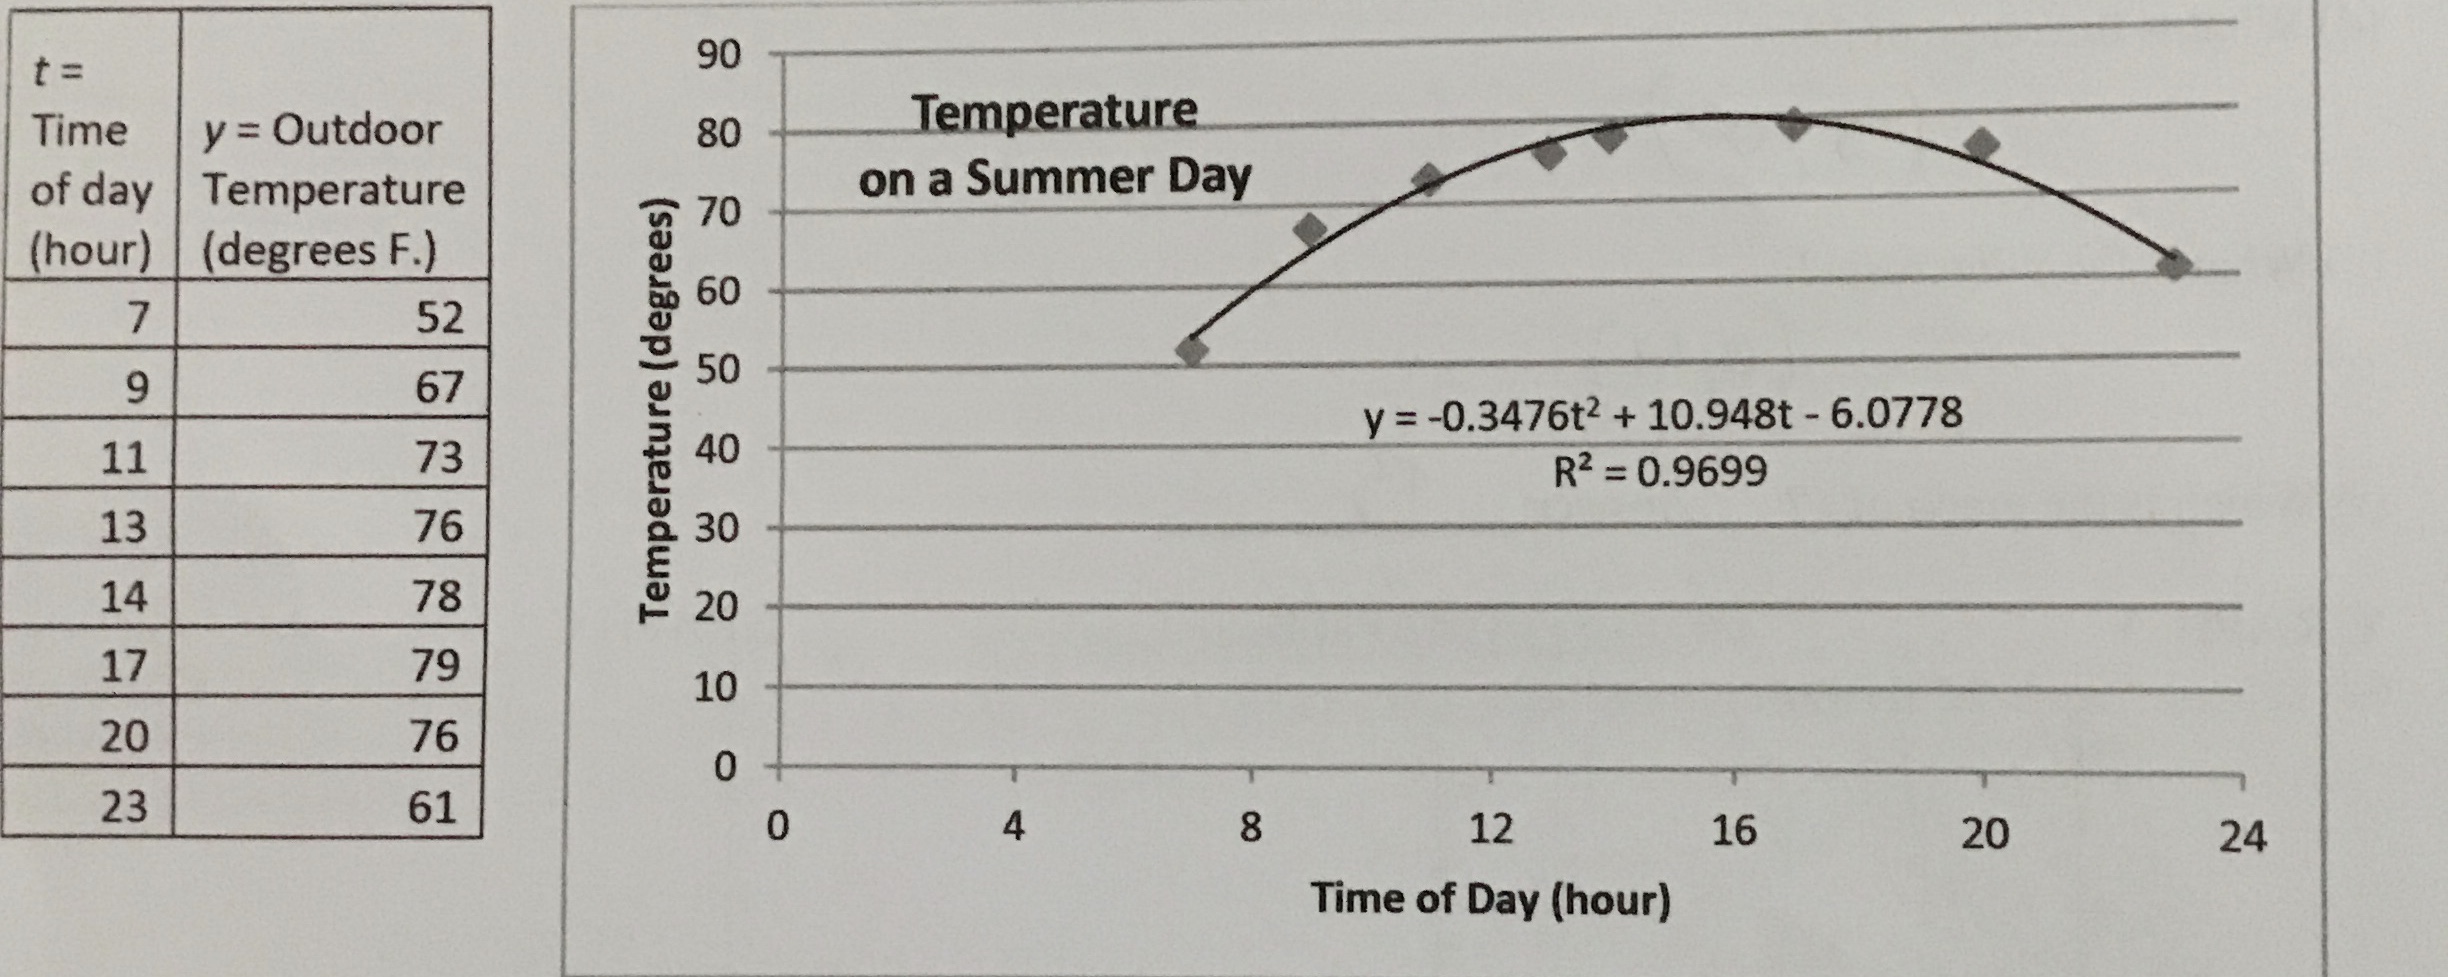
On a particular summer day the outdoor temperature was recorded at 8 times of the day and the following table was compiled. A scatterplot was
On a particular summer day the outdoor temperature was recorded at 8 times of the day and the following table was compiled. A scatterplot was produced and the parabola of best fit was determined.
Step by Step Solution
There are 3 Steps involved in it
Step: 1

Get Instant Access to Expert-Tailored Solutions
See step-by-step solutions with expert insights and AI powered tools for academic success
Step: 2

Step: 3
Ace Your Homework with AI
Get the answers you need in no time with our AI-driven, step-by-step assistance
Get Started
Introduction to Probability
Authors: Mark Daniel Ward, Ellen Gundlach
1st edition