On mat lab
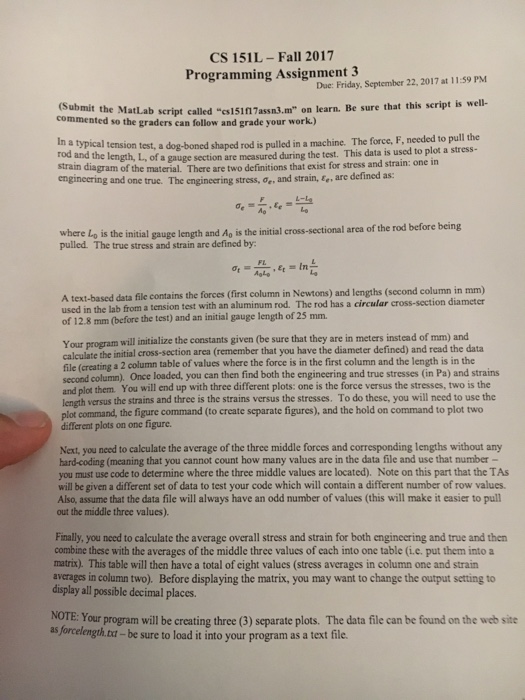
CS 151L-Fall 2017 Programming Assignment 3 Due: Friday, September 22, 2017 at 11:59 PM (Submit the MatLab script called "cs1517assn3. commented so the graders can follow and grade your work.) m" on learn. Be sure that this script is well- In a typical tension test,a rod and the length, L, of strain diagram of the material. There are two definitions that exist for stress and strain: one in engineering and one true. Te cngineering stress, ,, dog-boned shaped rod is pulled in a machine. The force, F, needed to pull the a gauge section are measured during the test. This data is used to plot a stress- and strain, ,, are defined as: Lo where lo is the initial gauge length and Ao is the initial cross-sectional arca of the rod before being pulled. The true stress and strain are defined by stLa A text-based data file contains the forces (first column in Newtons) and lengths (second column in mm) used in the lab from of 12.8 mm (before the test) and an initial gauge length of 25 mm. a tension test with an aluminum rod. The rod has a circular cross-section diameter constants given (be sure that they are in meters instcad of mm) and Your program will initialize the calculate the initial cross-section area (remember that you have the diameter defined) and read the data file (creating a 2 column table of values where the force is in the first column and the length is in the second column), Once loaded, you can then find both the engineering and true stresses (in Pa) and strains and plot them. You will end up with three different plots: one is the force versus the stresses, two is the length versus the strains and three is the strains versus the stresses. To do these, you will need to use tho plot command, the figure command (to create separate figures), and the hold on command to plot two different plots on one figure Next, you need to calculate the average of the three middle forces and corresponding lengths without any hard-coding (meaning that you cannot count how many values are in the data file and use that number- you must use code to determine where the three middle values are located). Note on this part that the TAS will be given a different set of data to test your code which will contain a different number of row values. Also, assume that the data file will always have an odd number of values (this will make it easier to pull out the middle three values). Finally, you need to calculate the average overall stress and strain for both engineering and true and then combine these with the averages of the middle three values of each into one table (i.e. put them into a matrix). This table will then have a total of cight values (stress averages in column one and strain averages in column two). Before displaying the matrix, you may want to change the output setting to display all possible decimal places. NOTE: Your program will be creating three (3) separate plots. The data file can be found on the web site as forcelength.cxt -be sure to load it into your program as a text file
 On mat lab


