

Answered step by step
Verified Expert Solution
Question
1 Approved Answer
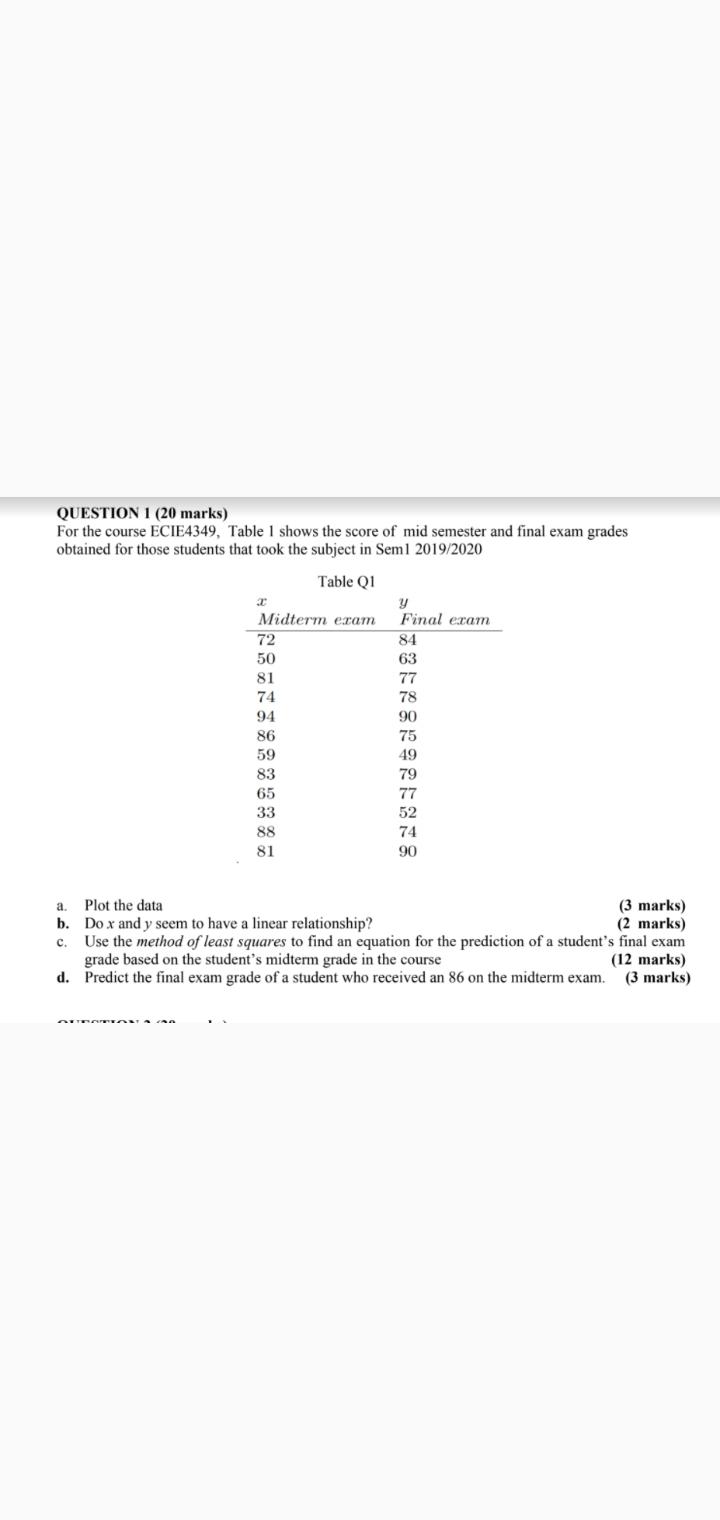
on QUESTION 1 (20 marks) For the course ECIE4349, Table 1 shows the score of mid semester and final exam grades obtained for those students
 on
on
Step by Step Solution
There are 3 Steps involved in it
Step: 1

Get Instant Access to Expert-Tailored Solutions
See step-by-step solutions with expert insights and AI powered tools for academic success
Step: 2

Step: 3
Ace Your Homework with AI
Get the answers you need in no time with our AI-driven, step-by-step assistance
Get Started
Relational Database Design A Practical Approach
Authors: Marilyn Campbell
1st Edition
1587193175, 978-1587193170