

Question
On the basis of the data in table below... a) Regress the number of homeruns ( y ) onto the number of hits ( x
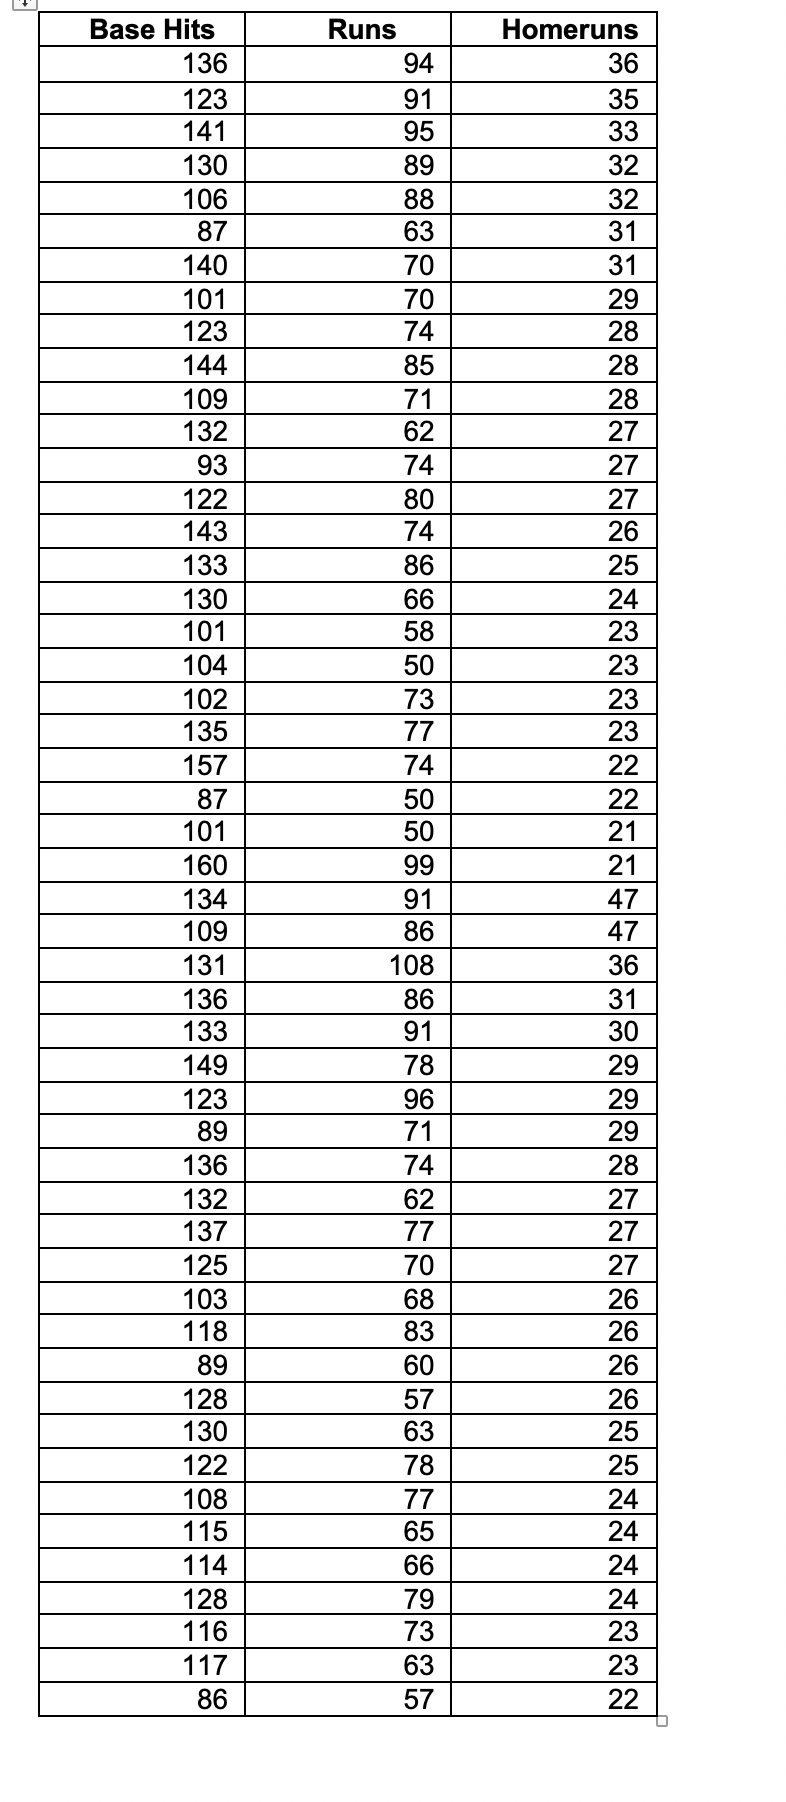
On the basis of the data in table below...
a) Regress the number of homeruns (y) onto the number of hits (x) & give the regression equation in the form y^=a+bx. How would you interpret the regression coefficient in terms of hits and homeruns?
b) Then ploty(L2) against x(L1) with the regression line. Provide a scatterplot and regression line. Does the relationship appear linear? Why or why not? Does the data plot indicate that there is a linear relationship between hits and homeruns? Why or why not?
c) Calculate the predicted number of home runs for the player with 93 hits and the residual for that player. Would this residual be above or below the regression line?
d) Then plot the residuals against the x-values. What does the residual plot suggest about the possible non-linearity of the relationship between hits and home runs?
e) Would you characterize hits and home runs as having a strong linear relationship, a weak linear relationship, a strong non-linear relationship, a weak non-linear relationship, or no relationship? Explain using the data plot, and the residual plot. How are residuals used in the definition of least-squares regression?
Step by Step Solution
There are 3 Steps involved in it
Step: 1

Get Instant Access to Expert-Tailored Solutions
See step-by-step solutions with expert insights and AI powered tools for academic success
Step: 2

Step: 3
Ace Your Homework with AI
Get the answers you need in no time with our AI-driven, step-by-step assistance
Get Started
Discovering Advanced Algebra An Investigative Approach
Authors: Jerald Murdock, Ellen Kamischke, Eric Kamischke
1st edition
1559539844, 978-1604400069, 1604400064, 978-1559539845