

Answered step by step
Verified Expert Solution
Question
1 Approved Answer
On the Fiction worksheet create a chart to show January sales. Select the best chart type and place the chart below the data table. Size
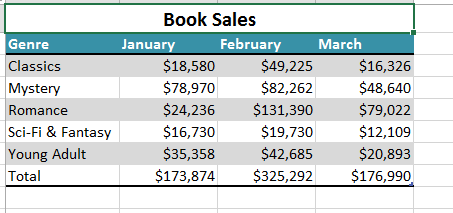
- On the Fiction worksheet create a chart to show January sales. Select the best chart type and place the chart below the data table.
- Size the chart so that the right edge ends in column D
- Explode the chart element that represents the smallest January sales Genre.
- Createa chart sheet with a cluster column chart that summarizes first quarter sales for all fiction books. To help with next year's marketing campaign, select enough data to show which book Genre had the most sales for each month. Use Genre as the X axis.
- On this chart sheet change the chart title to First Quarter Fiction Sales. Format the title as needed. Rename the sheet as Q1Fiction.
- On the Fiction worksheet, create a stacked column chart that compares January, February and March sales for all fiction Genres.
- Place the chart with the upper left corner in E2.
- Edit the chart title to read Q1 Fiction Sales.
- Createa chart sheet that show line chart of first quarter sales for all fiction book Genres. The X axis should represent months to show changes in sales over time.
- On this chart sheet change the chart title to First Quarter Fiction Sales Over time. Format the title as needed. Rename the sheet as Q1Time.
- Ensure that the worksheets are correctly named and placed in the following order in the workbook: Fiction, Q1Fictions, Q1Time and FictionBackup. Save the workbook. Close the workbook and then exit Excel. Submit the workbook as directed.
Step by Step Solution
There are 3 Steps involved in it
Step: 1

Get Instant Access to Expert-Tailored Solutions
See step-by-step solutions with expert insights and AI powered tools for academic success
Step: 2

Step: 3
Ace Your Homework with AI
Get the answers you need in no time with our AI-driven, step-by-step assistance
Get Started
The Teams Audit
Authors: Kevin Barham
1st Edition
1907766030, 978-1907766039