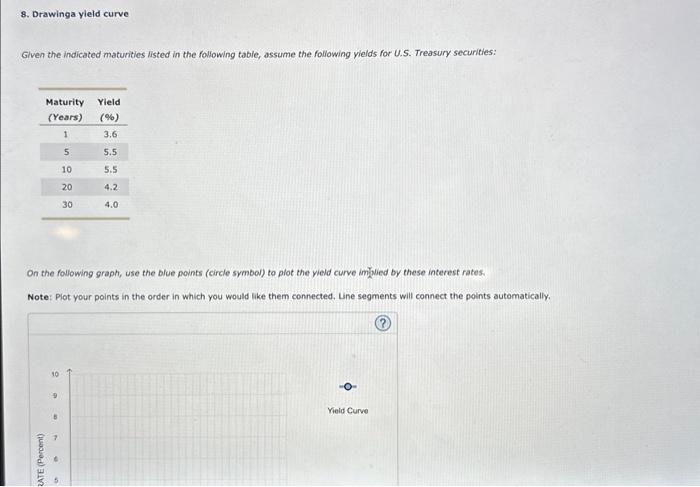
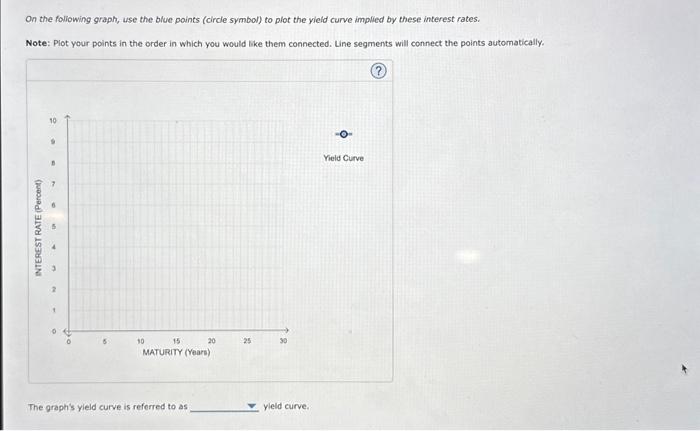
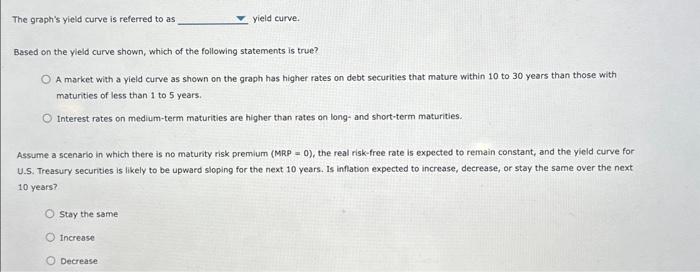
On the foliowing graph, use the blue points (circle symbol) to plot the yield curve implied by these interest rates. Note: Plot your points in the order in which you would like them connected. Line segments will connect the points automatically. The graph's yield curve is reforred to as yleld curve. 8. Drawinga yield curve Given the indicated maturities listed in the following table, assume the following yields for U.S. Treasury securities: On the following graph, use the blue points (circle symbol) to plot the yield curve im Note: Plot your points in the order in which you would like them connected. Line segments will connect the points automatically. The graph's yield curve is referred to as yield curve. Based on the yield curve shown, which of the following statements is true? A market with a yield curve as shown on the graph has higher rates on debt securities that mature within 10 to 30 years than those with maturities of less than 1 to 5 years. Interest rates on medium-term maturities are higher than rates on long- and short-term maturities. Assume a scenario in which there is no maturity risk premium (MRP =0 ), the real risk-free rate is expected to remain constant, and the yield curve for U.S. Treasury securities is likely to be upward sloping for the next 10 years. Is inflation expected to increase, decrease, or stay the same over the next 10 years? Stay the same Increase Decrease On the foliowing graph, use the blue points (circle symbol) to plot the yield curve implied by these interest rates. Note: Plot your points in the order in which you would like them connected. Line segments will connect the points automatically. The graph's yield curve is reforred to as yleld curve. 8. Drawinga yield curve Given the indicated maturities listed in the following table, assume the following yields for U.S. Treasury securities: On the following graph, use the blue points (circle symbol) to plot the yield curve im Note: Plot your points in the order in which you would like them connected. Line segments will connect the points automatically. The graph's yield curve is referred to as yield curve. Based on the yield curve shown, which of the following statements is true? A market with a yield curve as shown on the graph has higher rates on debt securities that mature within 10 to 30 years than those with maturities of less than 1 to 5 years. Interest rates on medium-term maturities are higher than rates on long- and short-term maturities. Assume a scenario in which there is no maturity risk premium (MRP =0 ), the real risk-free rate is expected to remain constant, and the yield curve for U.S. Treasury securities is likely to be upward sloping for the next 10 years. Is inflation expected to increase, decrease, or stay the same over the next 10 years? Stay the same Increase Decrease