

Answered step by step
Verified Expert Solution
Question
1 Approved Answer
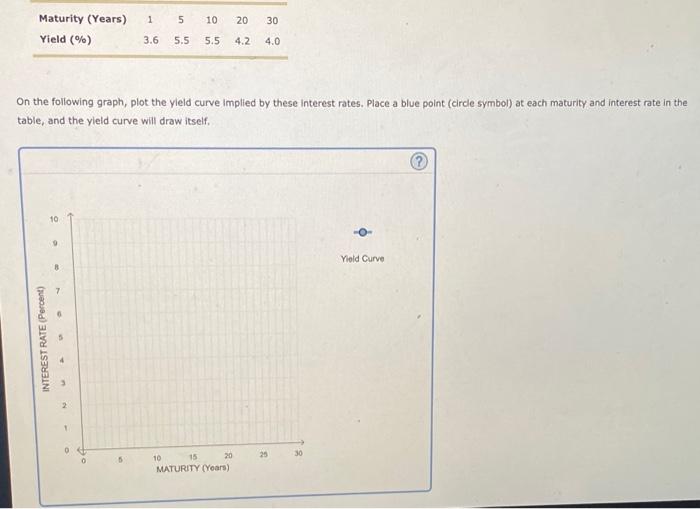
On the following graph, plot the yleld curve implied by these interest rates. Place a blue polnt (circle symbol) at each maturity and interest rate
Step by Step Solution
There are 3 Steps involved in it
Step: 1

Get Instant Access to Expert-Tailored Solutions
See step-by-step solutions with expert insights and AI powered tools for academic success
Step: 2

Step: 3
Ace Your Homework with AI
Get the answers you need in no time with our AI-driven, step-by-step assistance
Get Started
Short Term Financial Management
Authors: Terry S. Maness, John T. Zietlow
2nd Edition
0030315131, 978-0030315138