

Answered step by step
Verified Expert Solution
Question
1 Approved Answer
On the following graph, use the blue points ( circle symbols ) to plot the U . S . dollar cash flows from the original
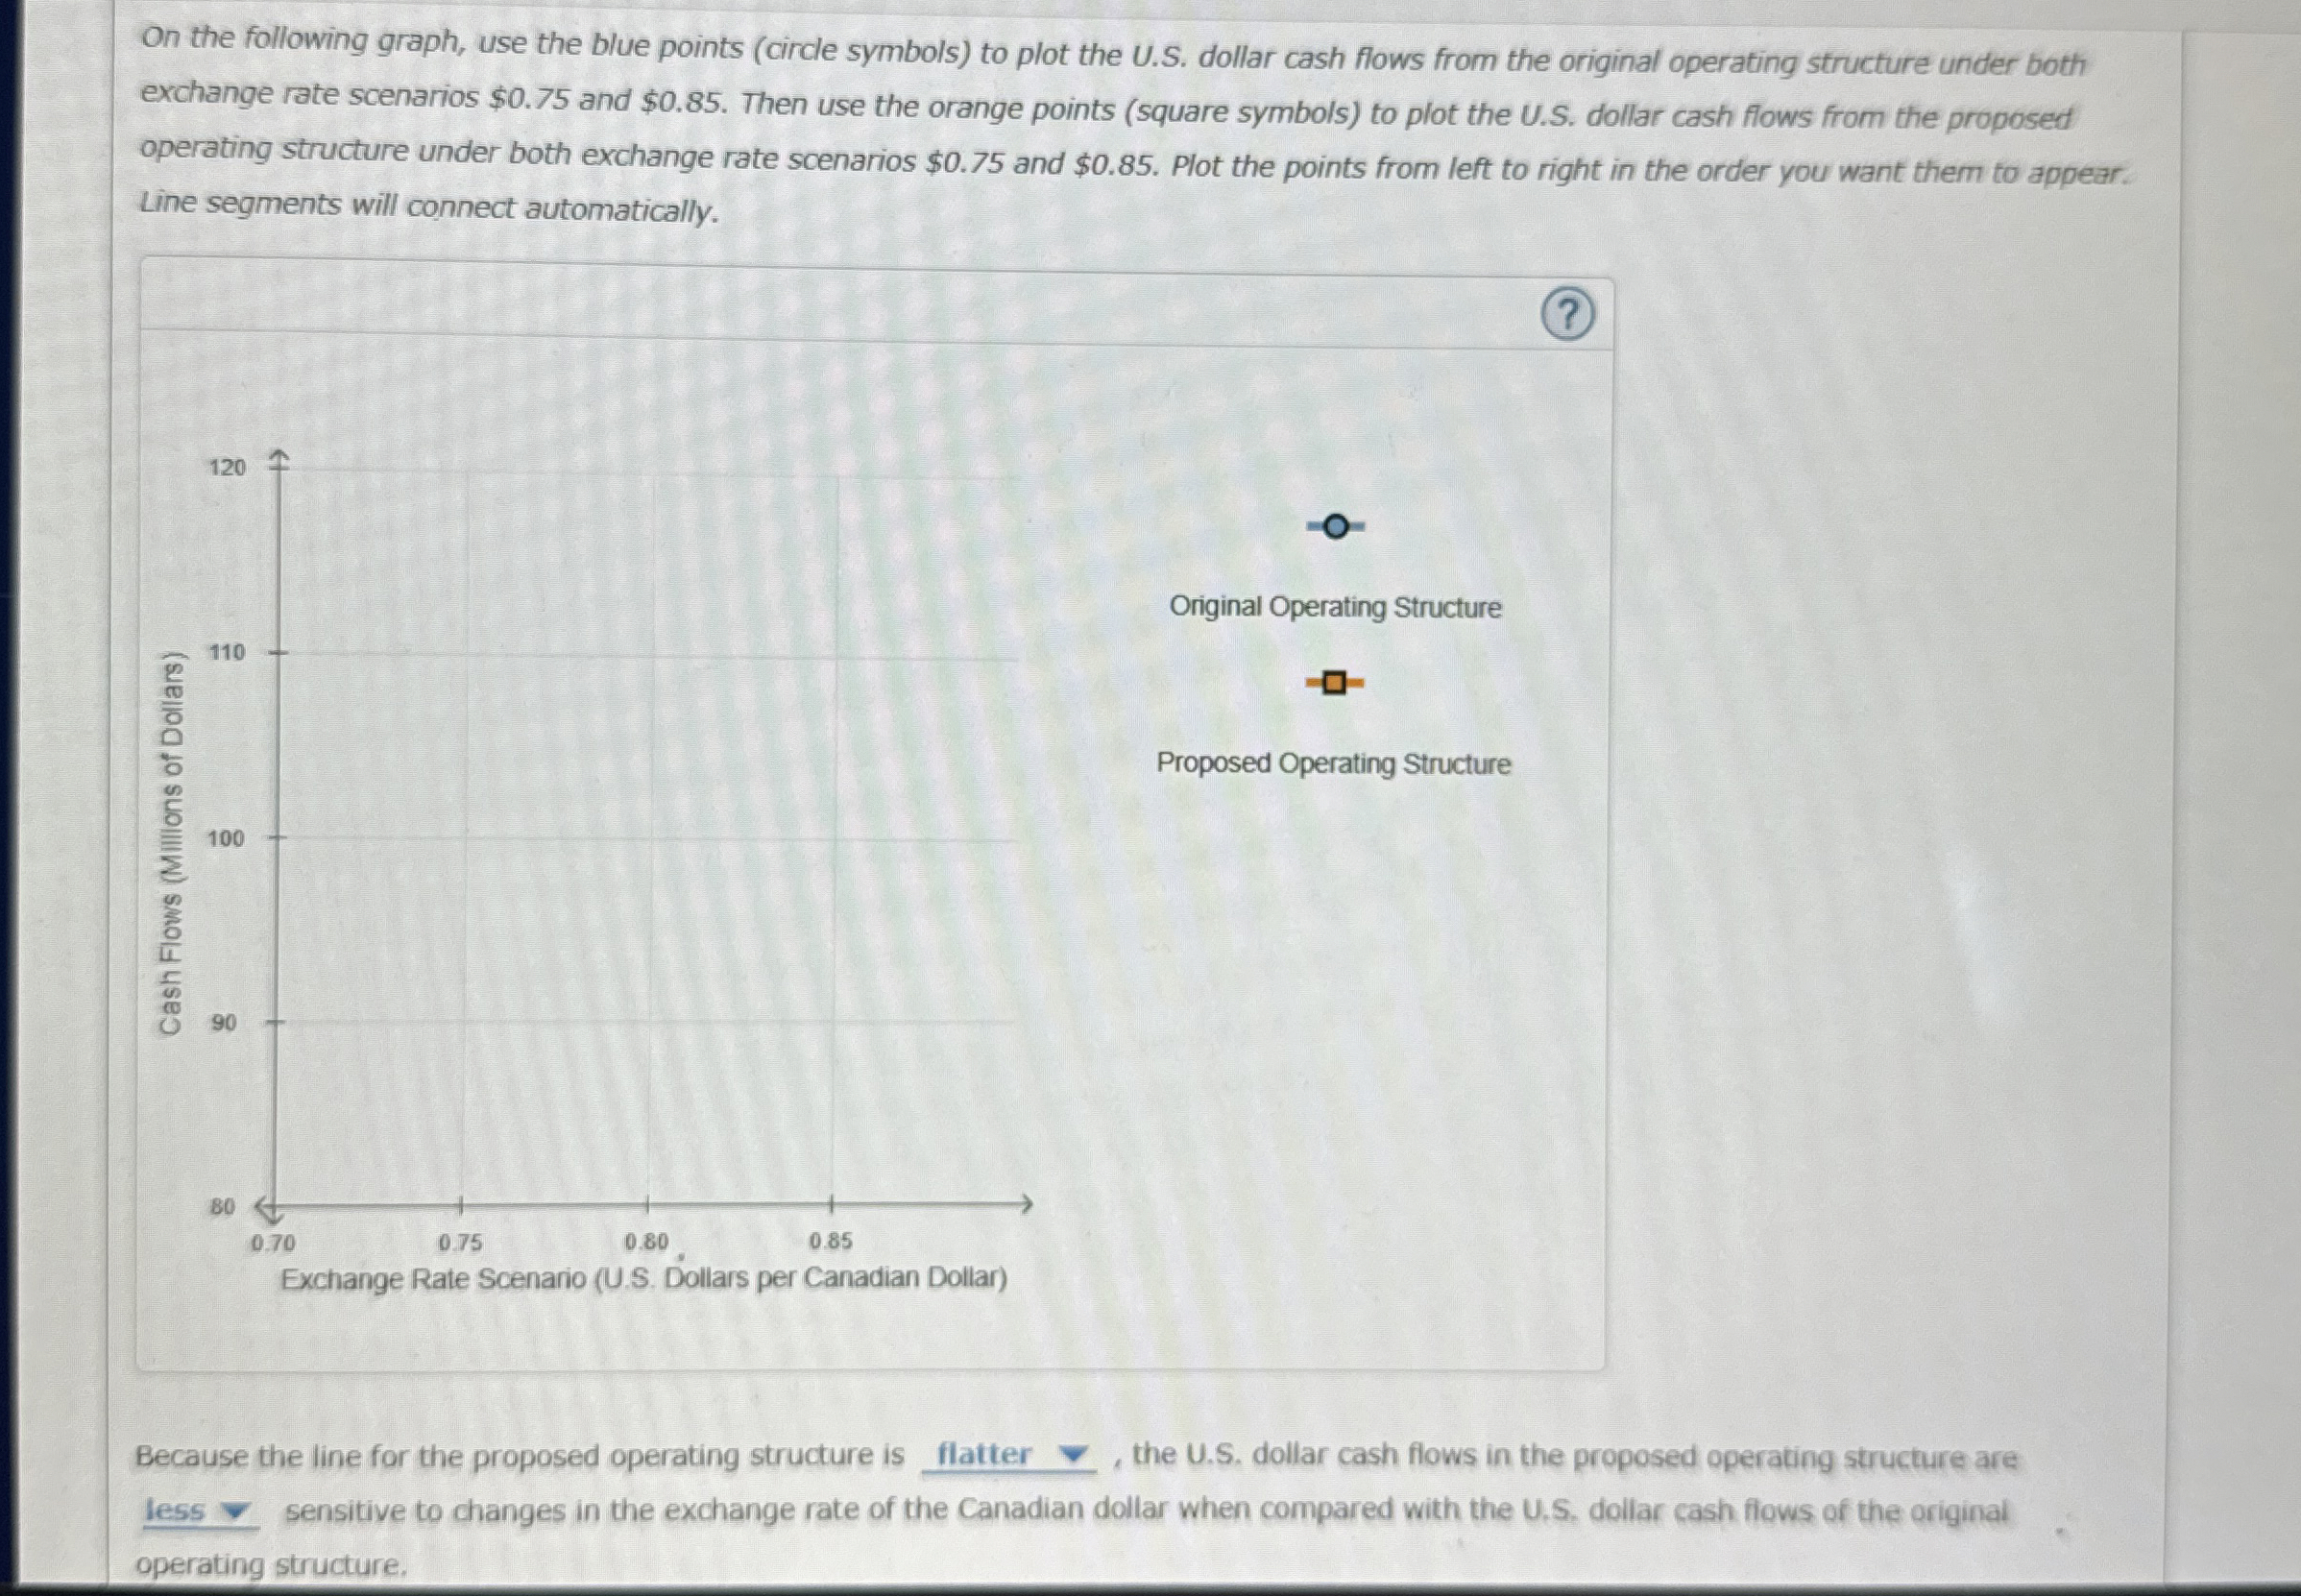
On the following graph, use the blue points circle symbols to plot the US dollar cash flows from the original operating structure under both
exchange rate scenarios $ and $ Then use the orange points square symbols to plot the US dollar cash flows from the proposed
operating structure under both exchange rate scenarios $ and $ Plot the points from left to right in the order you want them to appear.
Line segments will connect automatically.
Because the line for the proposed operating structure is flatter grad, the US dollar cash flows in the proposed operating structure are
less sensitive to changes in the exchange rate of the Canadian dollar when compared with the US dollar cash flows of the original
operating structure.
Step by Step Solution
There are 3 Steps involved in it
Step: 1

Get Instant Access to Expert-Tailored Solutions
See step-by-step solutions with expert insights and AI powered tools for academic success
Step: 2

Step: 3
Ace Your Homework with AI
Get the answers you need in no time with our AI-driven, step-by-step assistance
Get Started
How To Create Your Own Erc20 Cryptocurrency On Polygon
Authors: Praveen Soundarajan ,Keerthana Buvaneshwaran
1st Edition
979-8464850132