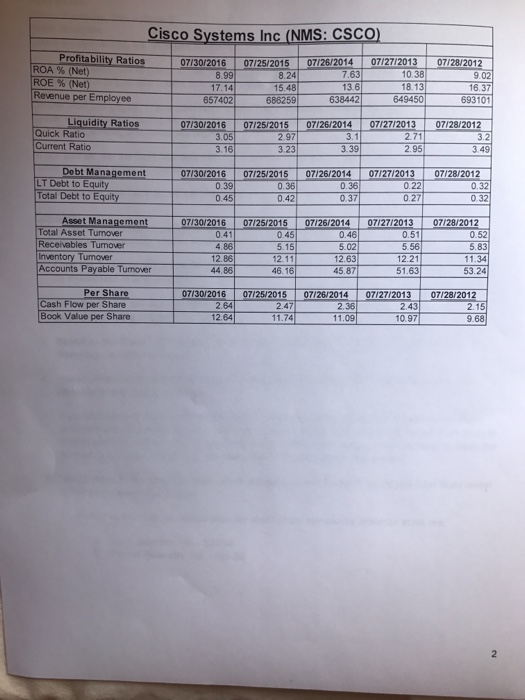
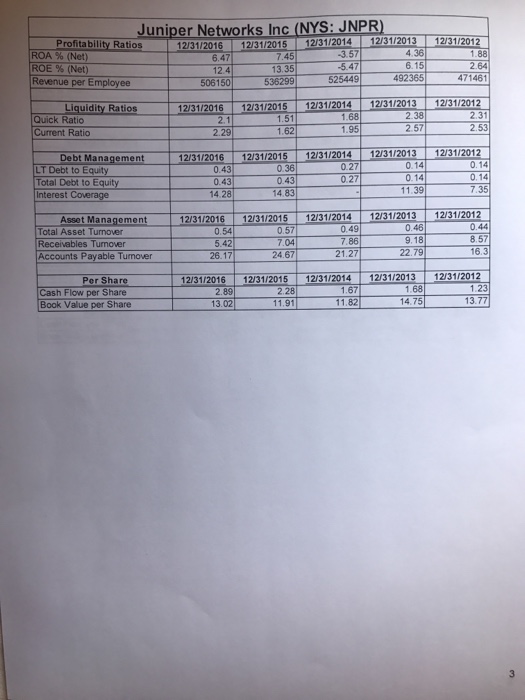
On the next two pages, I have attached the key financial ratios analyses for each company-Cisco Systems and Juniper Networks. The ratios are listed in the 4 major categories- Profitability, Liquidity Debt Management, and Asset Management. In our course, we the Debt Management ratios are called Solvency ratios and the Asset Management ratios are called either Efficiency ratios or Turnover ratios The schedules also have some per share ratios. Required Using the relevant ratios from the attached schedules, please answer the following questions. In answering each question, please explain your reasoning using the relevant ratio(s) from the attached 1. Over the 5-year period presented, which company was most efficient as generating revenue from its investment in total assets? 2. Over the 5-year period presented, which company was best able to meet their periodic interest 3. Based on the 5-year performance, which company generated the highest return on its total 4. Based on the 5-year performance, which company is in the best position to meet its long-term debt 5. If you were a bank lending officer and each of these companies applied for a $500 million short- payments related to debt obligations? financing, ie. debt and equity? obligations and stay in business? term borrowing (i.e. to be repaid in a less than a year), which company would you be more likely to lend to and why? Would your decision and analysis differ if the company was required to repay the borrowing in 5-years rather than less than a year? Please explain your answer 6. Based solely on the attached ratios, which company's common stock would you most likely invest in? Please explain your answer. Note: Assume that the market price per share of the companies' common stock are: a. Cisco Systems, Inc. $30.98 b. Juniper Networks. Inc. $29.20