Answered step by step
Verified Expert Solution
Link Copied!

Question

1 Approved Answer

Once each day, a sample of 96 components is randomly taken and the # of defective components (out of 96 ), is recorded. Given the
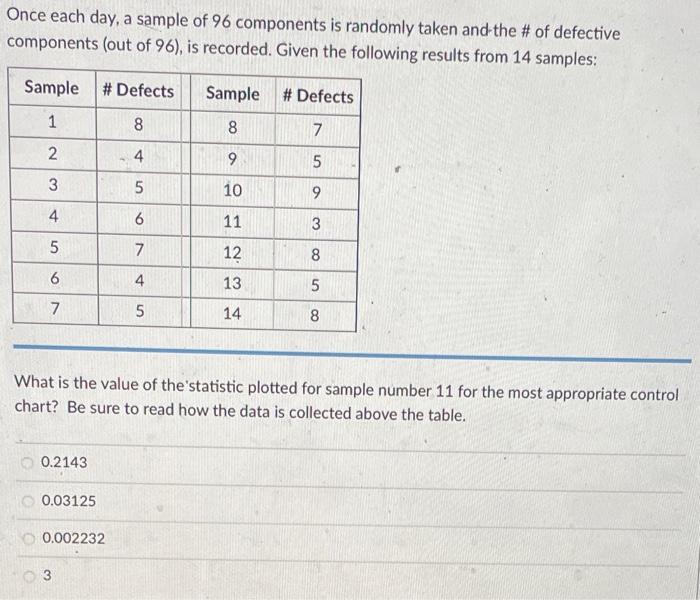
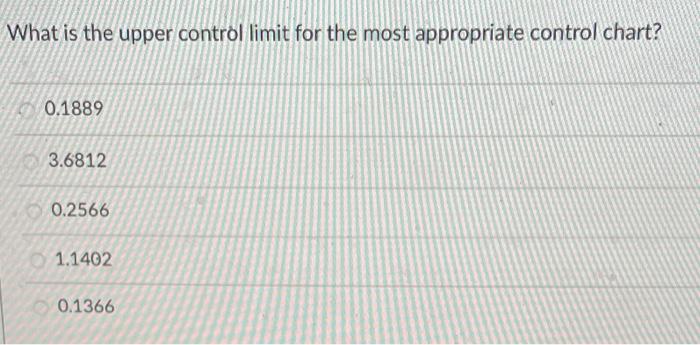
image text in transcribed
Once each day, a sample of 96 components is randomly taken and the \# of defective components (out of 96 ), is recorded. Given the following results from 14 samples: What is the value of the 'statistic plotted for sample number 11 for the most appropriate control chart? Be sure to read how the data is collected above the table. 0.21430.031250.002232 What is the upper control limit for the most appropriate control chart? 0.1889 3.6812 0.2566 1.1402 0.1366

Step by Step Solution

There are 3 Steps involved in it

Step: 1

blur-text-image

Get Instant Access to Expert-Tailored Solutions

See step-by-step solutions with expert insights and AI powered tools for academic success

Step: 2

blur-text-image_2

Step: 3

blur-text-image_3

Ace Your Homework with AI

Get the answers you need in no time with our AI-driven, step-by-step assistance

Get Started

Recommended Textbook for

Operations Management For MBAs

Authors: Jack R. Meredith, Scott M. Shafer

5th Edition

1118369971, 978-1118369975

More Books

Students also viewed these General Management questions

Question

Graph y = - 1 / 4 x + 3 using the slope and the y-intercept.

Answered: 1 week ago