

Answered step by step
Verified Expert Solution
Question
1 Approved Answer
only 5-6 begin{tabular}{cc|c|cc} hline obsno & roe & salary & salary & ul~ hline 1 & 14.1 & 1095 & 1224.058 & 129.058
only 5-6 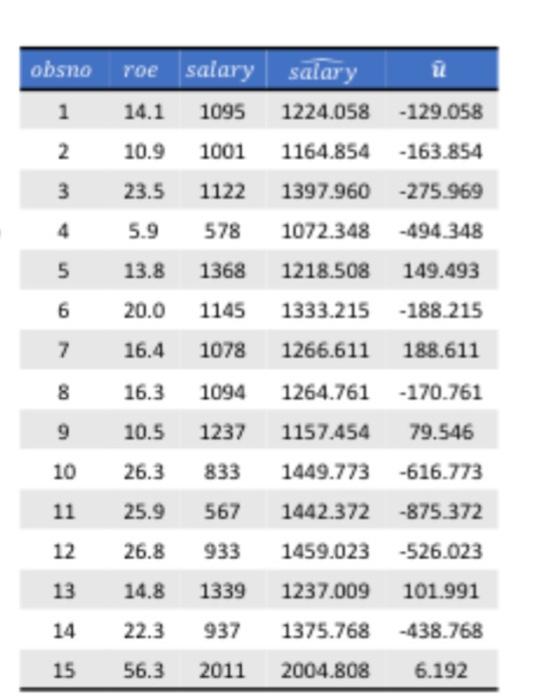
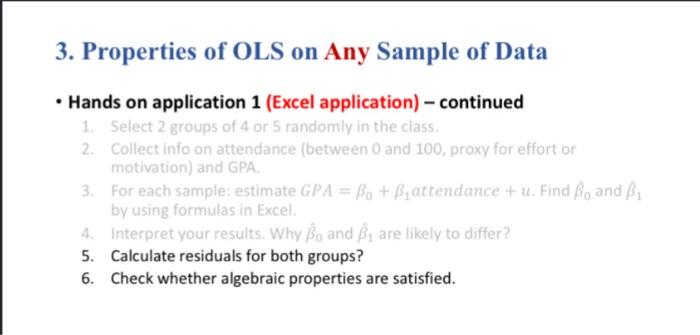
\begin{tabular}{cc|c|cc} \hline obsno & roe & salary & salary & ul~ \\ \hline 1 & 14.1 & 1095 & 1224.058 & 129.058 \\ 2 & 10.9 & 1001 & 1164.854 & 163.854 \\ 3 & 23.5 & 1122 & 1397.960 & 275.969 \\ 4 & 5.9 & 578 & 1072.348 & 494.348 \\ 5 & 13.8 & 1368 & 1218.508 & 149.493 \\ 6 & 20.0 & 1145 & 1333.215 & 188.215 \\ 7 & 16.4 & 1078 & 1266.611 & 188.611 \\ 8 & 16.3 & 1094 & 1264.761 & 170.761 \\ 9 & 10.5 & 1237 & 1157.454 & 79.546 \\ 10 & 26.3 & 833 & 1449.773 & 616.773 \\ 11 & 25.9 & 567 & 1442.372 & 875.372 \\ 12 & 26.8 & 933 & 1459.023 & 526.023 \\ 13 & 14.8 & 1339 & 1237.009 & 101.991 \\ 14 & 22.3 & 937 & 1375.768 & 438.768 \\ 15 & 56.3 & 2011 & 2004.808 & 6.192 \\ \hline \end{tabular} 3. Properties of OLS on Any Sample of Data - Hands on application 1 (Excel application) - continued 1. Select 2 groups of 4 or 5 randomly in the class. 2. Collect info on attendance (between 0 and 100, proxy for effort or motivation) and GPA. 3. For each sample: estimate GPA=0+1 attendance +u. Find 0 and 1 by using formulas in Excel. 4. Interpret your results. Why 0 and 1 are likely to differ? 5. Calculate residuals for both groups? 6. Check whether algebraic properties are satisfied. \begin{tabular}{cc|c|cc} \hline obsno & roe & salary & salary & ul~ \\ \hline 1 & 14.1 & 1095 & 1224.058 & 129.058 \\ 2 & 10.9 & 1001 & 1164.854 & 163.854 \\ 3 & 23.5 & 1122 & 1397.960 & 275.969 \\ 4 & 5.9 & 578 & 1072.348 & 494.348 \\ 5 & 13.8 & 1368 & 1218.508 & 149.493 \\ 6 & 20.0 & 1145 & 1333.215 & 188.215 \\ 7 & 16.4 & 1078 & 1266.611 & 188.611 \\ 8 & 16.3 & 1094 & 1264.761 & 170.761 \\ 9 & 10.5 & 1237 & 1157.454 & 79.546 \\ 10 & 26.3 & 833 & 1449.773 & 616.773 \\ 11 & 25.9 & 567 & 1442.372 & 875.372 \\ 12 & 26.8 & 933 & 1459.023 & 526.023 \\ 13 & 14.8 & 1339 & 1237.009 & 101.991 \\ 14 & 22.3 & 937 & 1375.768 & 438.768 \\ 15 & 56.3 & 2011 & 2004.808 & 6.192 \\ \hline \end{tabular} 3. Properties of OLS on Any Sample of Data - Hands on application 1 (Excel application) - continued 1. Select 2 groups of 4 or 5 randomly in the class. 2. Collect info on attendance (between 0 and 100, proxy for effort or motivation) and GPA. 3. For each sample: estimate GPA=0+1 attendance +u. Find 0 and 1 by using formulas in Excel. 4. Interpret your results. Why 0 and 1 are likely to differ? 5. Calculate residuals for both groups? 6. Check whether algebraic properties are satisfied Step by Step Solution
There are 3 Steps involved in it
Step: 1

Get Instant Access to Expert-Tailored Solutions
See step-by-step solutions with expert insights and AI powered tools for academic success
Step: 2

Step: 3
Ace Your Homework with AI
Get the answers you need in no time with our AI-driven, step-by-step assistance
Get Started
Audit Proof Tax Shelters
Authors: Donald Jay Korn
1st Edition
0130509310, 978-0130509314