

Question
) Open the file Stocks.xlsx. Four stocks are available for creating a portfolio: Microsoft, ATT, GM, and GE. We have data on the mean, standard
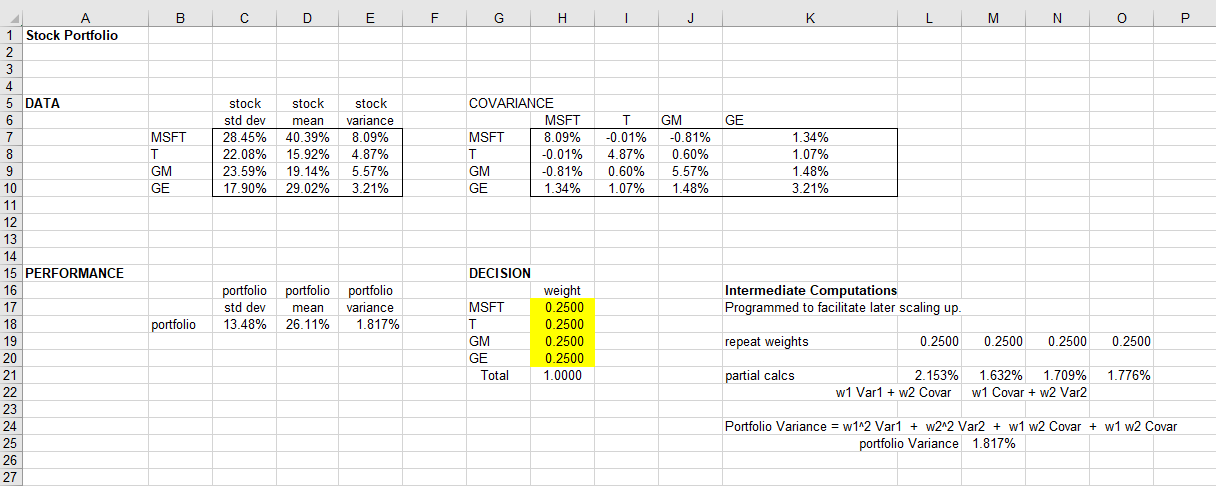
) Open the file Stocks.xlsx. Four stocks are available for creating a portfolio: Microsoft, ATT, GM, and GE. We have data on the mean, standard deviation, and the covariance of returns. If we chose to invest certain percentages of our assets in each of the four stocks we can determine the mean and standard deviation of the resulting portfolio, as in the accompanying spreadsheet. One way to formulate the problem of determining the optimal portfolio for an individual is to combine the mean and standard deviation of the return into a single measure of the overall utility of the portfolio. This can be done using a penalty factor (p) for the standard deviation, so that the utility is given by the mean return less a penalty for the standard deviation: U = Mean p*(Standard Deviation) The portfolio optimization problem then becomes one of finding the appropriate percentages, or weights, for each of the four stocks to maximize this utility measure. Note: all four weights must be non-negative.
a. (10 points) Assume you have a client whose penalty factor equals 2.0. Determine the optimal portfolio.
Report here the four weights, as well as the mean and standard deviation of the optimal portfolio.
Portfolio mean _____________ Portfolio standard deviation _____________ Weight for Microsoft _____________ Weight for ATT _____________ Weight for GM _____________ Weight for GE _____________
b. (10 points) Let the penalty factor vary from 0 to 3 in increments of 0.5. Determine the optimal portfolio for each value of p. Report here the optimal utility, portfolio mean return, and portfolio standard deviation. p Optimal utility Portfolio mean return Portfolio standard deviation 0.0 0.5 1.0 1.5 2.0 2.5 3.0
c. (10 points) Describe in words how and why the pattern of weights varies as the penalty factor p varies from 0 to 3.
STOCKS.XLSX
Step by Step Solution
There are 3 Steps involved in it
Step: 1

Get Instant Access to Expert-Tailored Solutions
See step-by-step solutions with expert insights and AI powered tools for academic success
Step: 2

Step: 3
Ace Your Homework with AI
Get the answers you need in no time with our AI-driven, step-by-step assistance
Get Started
Ecological Money And Finance
Authors: Thomas Lagoarde-Segot
1st Edition
3031142314, 978-3031142314