

Answered step by step
Verified Expert Solution
Question
1 Approved Answer
Operating profit margin - Return on sales - Return on assets - Return on equity - Thanks! Widget Corporation Summary Balance Sheets As of December
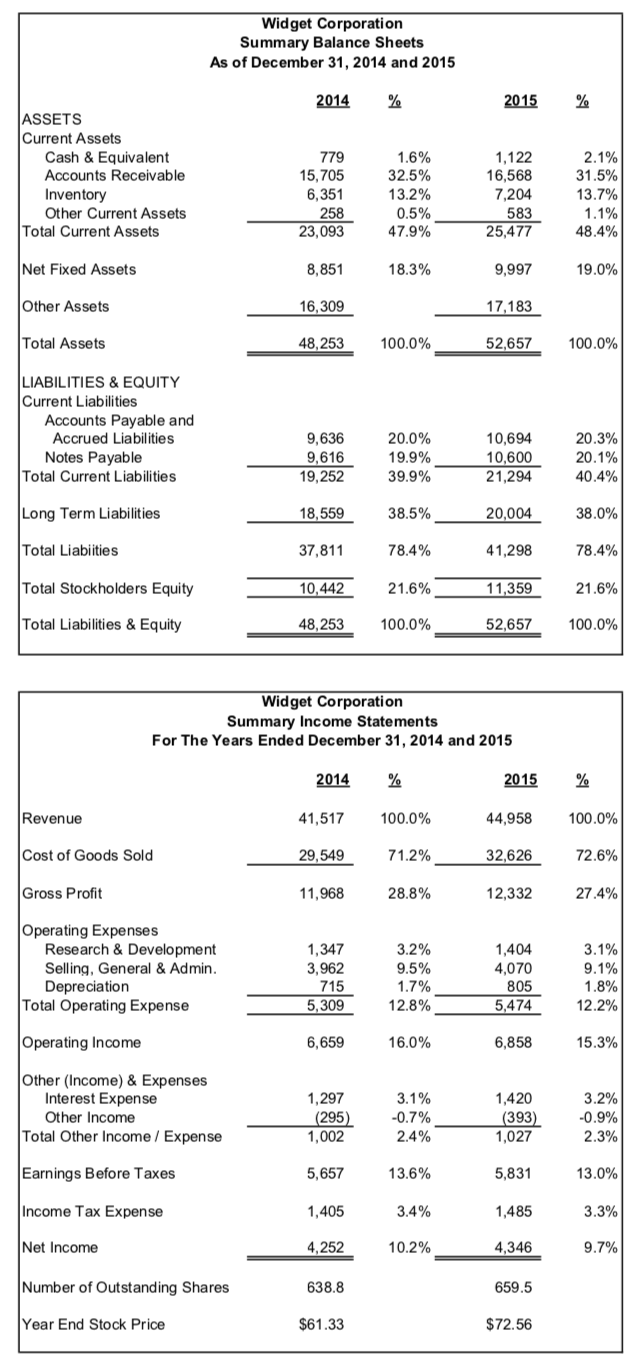
Operating profit margin -
Return on sales -
Return on assets -
Return on equity -
Thanks!
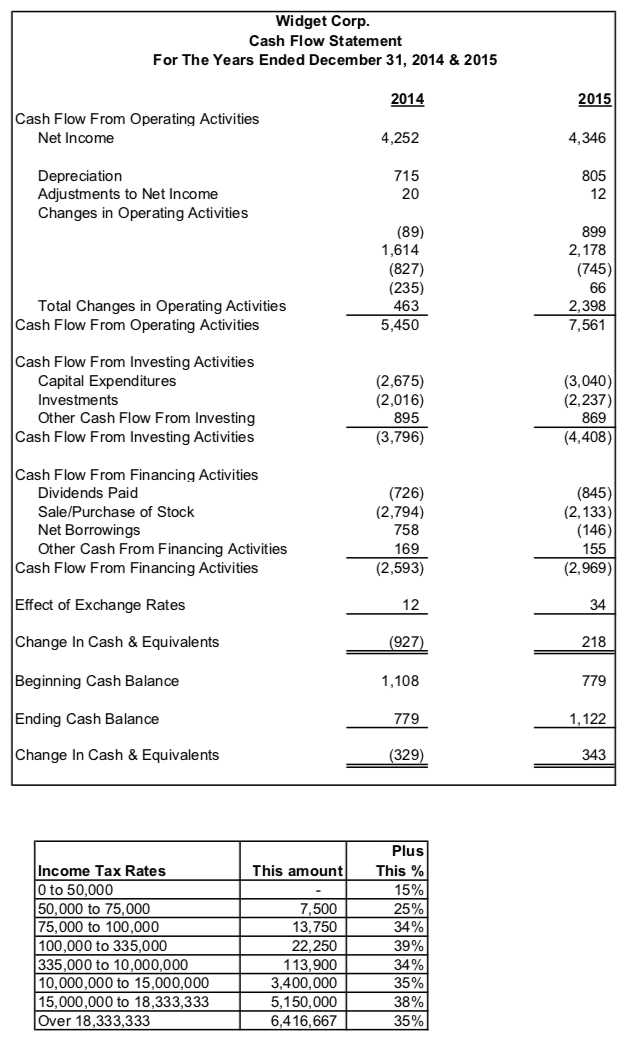
Widget Corporation Summary Balance Sheets As of December 31, 2014 and 2015 2014 % 2015 % ASSETS Current Assets Cash & Equivalent Accounts Receivable Inventory Other Current Assets Total Current Assets 779 15,705 6,351 258 23,093 1.6% 32.5% 13.2% 0.5% 47.9% 1,122 16,568 7,204 583 25,477 2.1% 31.5% 13.7% 1.1% 48.4% Net Fixed Assets 8,851 18.3% 9,997 19.0% Other Assets 16,309 17,183 Total Assets 48,253 100.0% 52,657 100.0%| LIABILITIES & EQUITY Current Liabilities Accounts Payable and Accrued Liabilities Notes Payable Total Current Liabilities 9,636 9,616 19,252 20.0% 19.9% 39.9% 10,694 10,600 21,294 20.3% 20.1% 40.4% Long Term Liabilities 18,559 38.5% 20,004 38.0% Total Liabiities 37,811 78.4% 41,298 78.4% Total Stockholders Equity Total Liabilities & Equity 10,442 48,253 21.6% 100.0% 11,359 52,657 21.6% 100.0%| Widget Corporation Summary Income Statements For The Years Ended December 31, 2014 and 2015 2014 % 2015 % Revenue 41,517 100.0% 44,958 100.0% Cost of Goods Sold 29,549 71.2% 32,626 72.6% Gross Profit 11,968 28.8% 12,332 27.4% Operating Expenses Research & Development Selling, General & Admin. Depreciation Total Operating Expense 1,347 3,962 715 3.2% 9.5% 1.7% 12.8% 1,404 4,070 805 5,474 3.1% 9.1% 1.8% 12.2% 5,309 Operating Income 6,659 16.0% 6,858 15.3% Other (Income) & Expenses Interest Expense Other Income Total Other Income / Expense 1,297 (295) 1,002 3.1% -0.7% 2.4% 1,420 (393) 1,027 3.2% -0.9% 2.3% Earnings Before Taxes 5,657 13.6% 5,831 13.0% Income Tax Expense 1,405 3.4% 1,485 3.3% Net Income 4,252 10.2% 4,346 9.7% Number of Outstanding Shares 638.8 659.5 Year End Stock Price $61.33 $72.56 Widget Corp. Cash Flow Statement For The Years Ended December 31, 2014 & 2015 2014 2015 Cash Flow From Operating Activities Net Income 4,252 4,346 Depreciation Adjustments to Net Income Changes in Operating Activities 715 20 805 12 (89) 1,614 (827) (235) 463 5,450 899 2,178 (745) 66 2,398 7,561 Total Changes in Operating Activities Cash Flow From Operating Activities Cash Flow From Investing Activities Capital Expenditures Investments Other Cash Flow From Investing Cash Flow From Investing Activities (2,675) (2,016) 895 (3,796) (3,040) (2,237) 869 (4,408) (845) Cash Flow From Financing Activities Dividends Paid Sale/Purchase of Stock Net Borrowings Other Cash From Financing Activities Cash Flow From Financing Activities (726) (2,794) 758 169 (2,593) (2,133) (146) 155 (2,969) Effect of Exchange Rates 34 12 (927) Change In Cash & Equivalents 218 Beginning Cash Balance 1,108 779 Ending Cash Balance 779 1,122 Change In Cash & Equivalents (329) 343 This amount Income Tax Rates O to 50,000 50,000 to 75,000 75,000 to 100,000 100,000 to 335,000 335,000 to 10,000,000 10,000,000 to 15,000,000 15,000,000 to 18,333,333 Over 18,333,333 13,750 22,250 113,900 3,400,000 5,150,000 6,416,667 Plus This % 15% 25% 34% 39% 34% 35% 38% 35%Step by Step Solution
There are 3 Steps involved in it
Step: 1

Get Instant Access to Expert-Tailored Solutions
See step-by-step solutions with expert insights and AI powered tools for academic success
Step: 2

Step: 3
Ace Your Homework with AI
Get the answers you need in no time with our AI-driven, step-by-step assistance
Get Started
Short Term Financial Management
Authors: Ned C. Hill, William L. Sartoris
3rd Edition
0023548320, 978-0023548321