Answered step by step
Verified Expert Solution
Question
1 Approved Answer
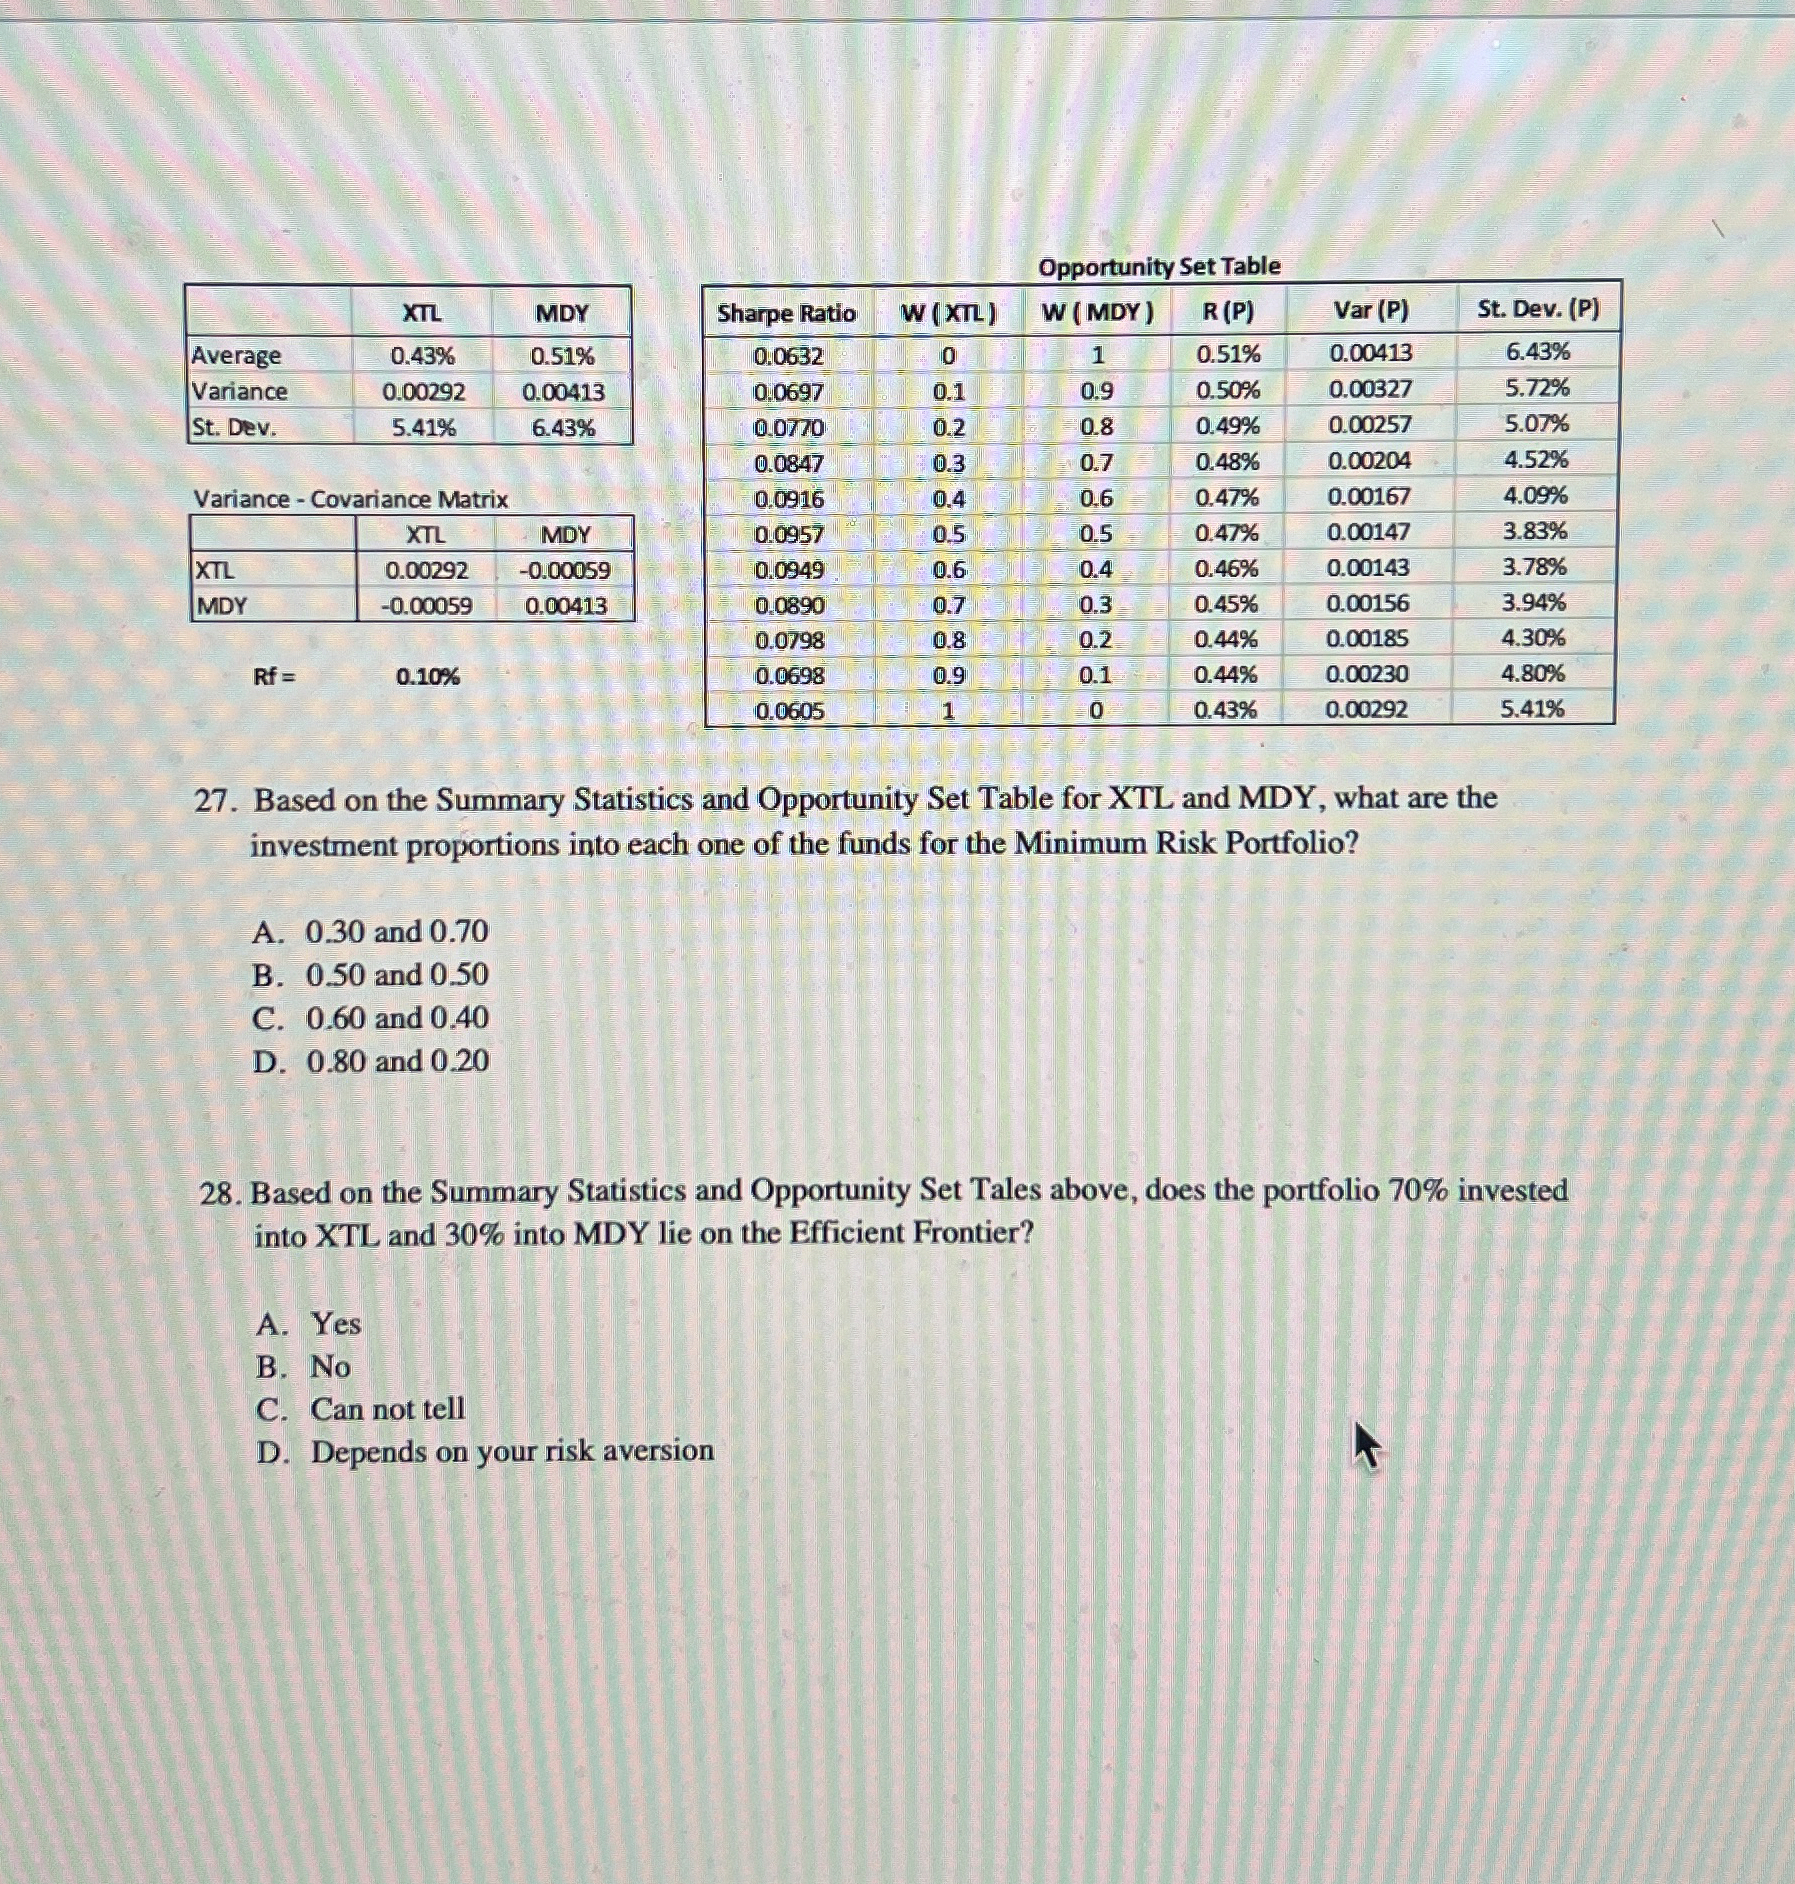
Opportunity Set Table Variance - Covariance Matrix R f = , 0 . 1 0 % Based on the Summary Statistics and Opportunity Set Table
Opportunity Set Table
Variance Covariance Matrix
Based on the Summary Statistics and Opportunity Set Table for XTL and MDY what are the
investment proportions into each one of the funds for the Minimum Risk Portfolio?
A and
B and
C and
D and
Based on the Summary Statistics and Opportunity Set Tales above, does the portfolio invested
into XTL and into MDY lie on the Efficient Frontier?
A Yes
B No
C Can not tell
D Depends on your risk aversion

Step by Step Solution
There are 3 Steps involved in it
Step: 1

Get Instant Access to Expert-Tailored Solutions
See step-by-step solutions with expert insights and AI powered tools for academic success
Step: 2

Step: 3

Ace Your Homework with AI
Get the answers you need in no time with our AI-driven, step-by-step assistance
Get Started


