

Question
Option #1:Batting The batting average of a baseball player is the number of hits divided by the number of at-bats. Recently, a certain major league
Option #1:Batting
The batting average of a baseball player is the number of "hits" divided by the number of "at-bats." Recently, a certain major league player's at-bats and corresponding hits were recorded for 200 consecutive games. The consecutive games span more than one season. Since each game is different, the number of at-bats and hits both vary. For this particular player, there were from zero to five at-bats. Thus, one can sort the 200 games into six categories:
0 at-bats
1 at-bat
2 at-bats
3 at-bats
4 at-bats
5 at-bats
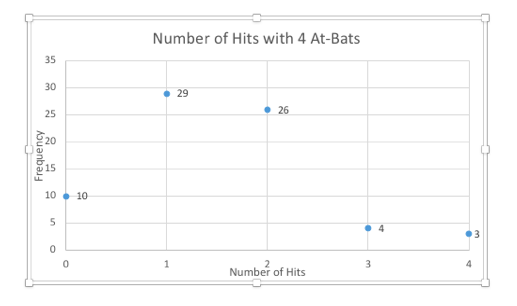
Consider the games where the player had exactly four at-bats. A similar analysis can be done for each of the other at-bats category. Download the file titled Bats. It contains a scatter plot of the four at-bats number of hits versus frequency. To compare the results to the Binomial Distribution, complete the following:
1.Explain why the four at-bats is a binomial experiment.
2.Using the Bats scatter plot, construct a frequency distribution for the number of hits.
3.Compute the mean number of hits. The formula for the mean is.
Here, xirepresent no. of hits (0, 1, 2, 3, 4) andfiis the corresponding frequency. Explain what the numerical result means.
4.From the frequency distribution, construct the corresponding probability distribution. Explain why it is a probability distribution. Then, use Excel to make a scatter plot of the probability distribution:
Select the two columns of the probability distribution. Click on INSERT, and then go to the Charts area and select Scatter. Then choose the first Scatter chart (the one without lines connecting).
5.Using the frequency distribution, what is the player's batting average for four at-bats? In part 3, note that the numerator in the formula for the mean is the total number of hits. The total number of at-bats is the denominator of the formula for the mean multiplied by 4.
6.The Binomial Distribution is uniquely determined by n, the number of trials, and p, the probability of "success" on each trial. Using Excel, construct the Binomial Probability Distribution for four trials, n, and probability of success, p, as the batting average in part 5. Here is an explanation of theBINOM.DIST functionin Excel.
For example, In Excel
=BINOM.DIST(7,15,0.7, FALSE)
represents the probability of 7 successes out of 15 (n) trials. The 0.7 is the probability of success, p.
7.Using the formula for the mean of the binomial distribution, what is the mean number of successes in part 6 up above?
8.In Excel, make a scatter plot for the binomial distribution. The instructions for making one are in part 4 up above.
9.Use the results up above to compare the probability distribution of four at bats and the Binomial Distribution. Compare the means in parts 4 and 6, too. If the probability
distribution of 4 at bats and the Binomial Distribution differ, explain why that is so
.
Step by Step Solution
There are 3 Steps involved in it
Step: 1

Get Instant Access to Expert-Tailored Solutions
See step-by-step solutions with expert insights and AI powered tools for academic success
Step: 2

Step: 3
Ace Your Homework with AI
Get the answers you need in no time with our AI-driven, step-by-step assistance
Get Started
Big Ideas Math A Common Core Curriculum Blue
Authors: Ron Larson, Laurie Boswell
1st Edition
1608402282, 978-1608402281