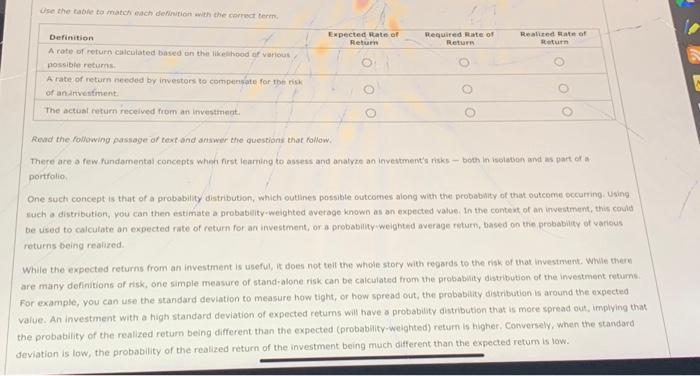
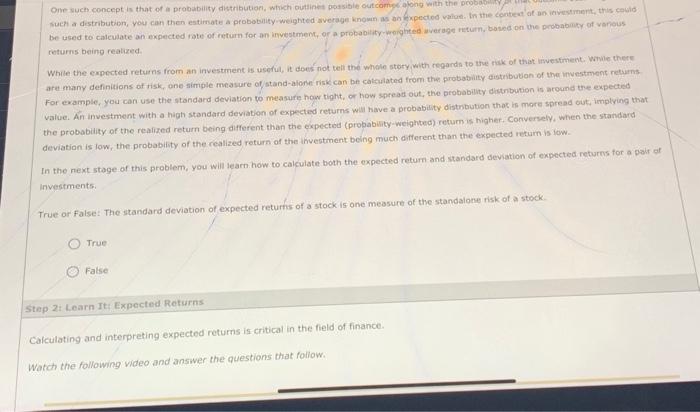
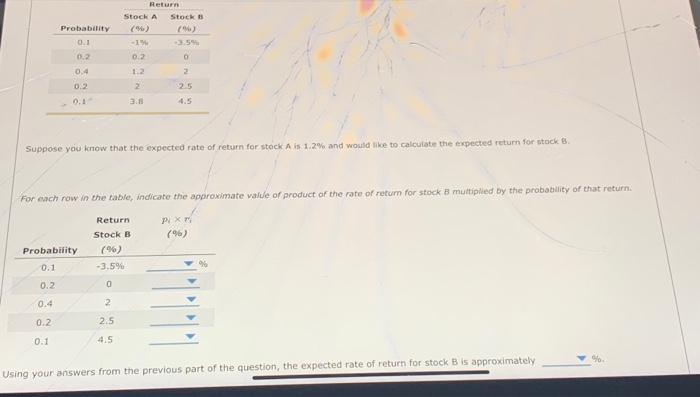
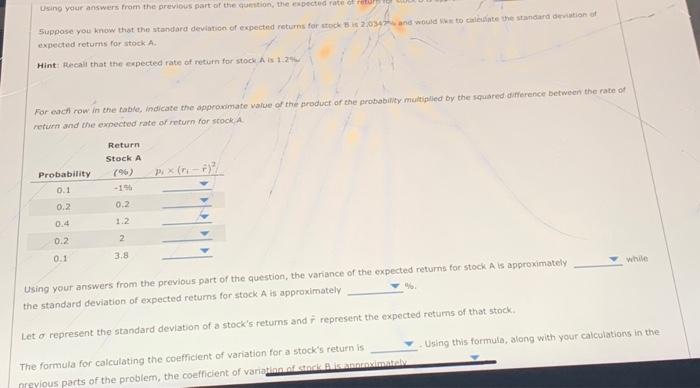
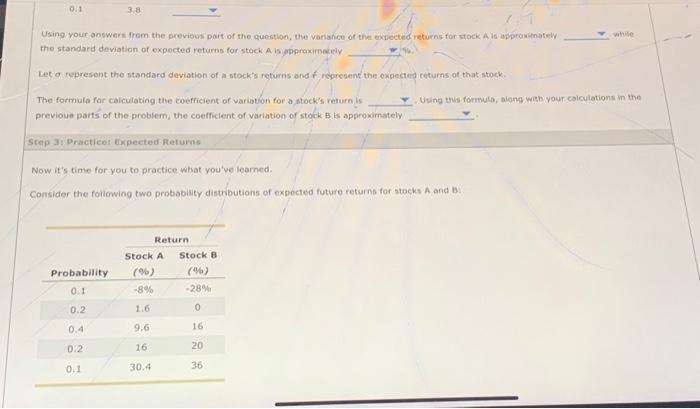
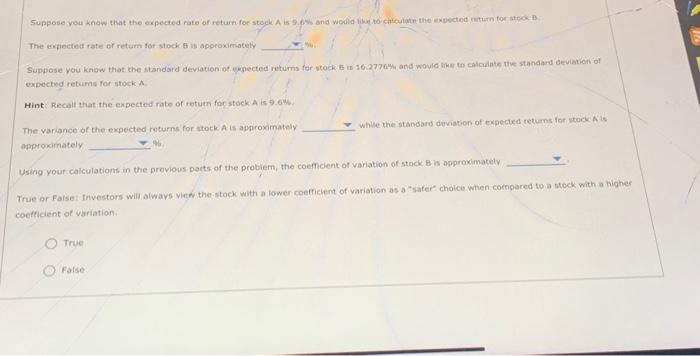
Ose the cable to match each definifien weh the cerrect term. Reval the following passage of text and atswer the questions that follow. There are a few fundomental concepts wheh first learning to assess and anatyre an invevement's risks - both in isolatban and as part of a. portfolio, One such concept is that of a probability distribution, which outlines possible outcomes aiong with the probablity of that outcome occurring. Using. such a distribution, you can then estimate a probabaity-weighted average known as an expected value. In the context of an unestment, this could be used to calculate an expected rate of return for an investment, or a probability weighted average return, based on the probability of varieus retures being realired. While the expected returns from an investment is useful, it does not tell the whole story with regards to the risk of that investrvent. While thern are many definitions of risk, one simple measure of stand-alone risk can be calculated from the probabuity disuibution of the investment retums. For example, you can use the standard deviation to measure how tight, or how spread out, the probabilty distribution is around the expected value. An investment with a high standard deviation of expected retums will have a probability distribution that is more spread out, implying the the probatbility of the realized return being different than the expected (probability-weighted) return is higher, Conversely, when the standard feviation is low, the probability of the realized return of the investment being much different than the expected return is iow. returns beino realized. are many definitions of risk, one-simple measure of/ stand-alore risk can be catculated from the probability eistributon of the investment returns For example, you can use the stondard deviation to measure how tight, or how spread out, the probability disthbution is around tre expected value. An investment with a high standard deviation of expected returns will have a probability distnbution thot is more spiresd out, implying that the probability of the realized return being different than the expected (propability-weighted) return is higher, Conversely, when the standard deviation is low, the probability of the realized return of the ifvestment bing much aifferent than the expected return is iow. In the next stage of this problem, you will learn how to calculate both the expected return and standard deviation of expected returms for a pair of investments. True or False: The standard deviation of expected returns of a stock is one measure of the standalone risk of a stock. True Fatse Step 2i Learn It: Expected Returns Calculating and interpreting expected returns is critical in the field of finance. Watch the following video and answer the questions that follow: Suppose you know that the expected rate of return for stock A is. 1.2% and wowld like to calculate the expected return for stock B. For each row in the table, indicate the approximate vafule of product of the rate of retum for stock B multipied by the prabability of that retur Using your answers from the previous part of the question, the expected rate of return for stock B is approximately Using your answers from the previous part of the aumsion, the eapected fate of retur expected returns for stock-A. return and the expected rate of return for stocki. the standard deviation of expected returns for stack A is approximately. 16. Let o represent the standard deviation of a stock's feturns and r represent the expected returns of that stock. The formula for calculating the coefficient of variation for a stock's return is Uging this formula, along with your calculations in the Using your answers from the previous port of the question, the variahce of the expected returns for stock A is approwitnatelv the standard deviation of expected returns for stock A is pporcximecily Let fepresent the standard deviation of a stock's returns and f represent the expected returns of that stock. The formula for calculating the coefficient of variation for a stock's return is Using this formulo, along with your calculations in the previoua parts of the problem, the coefficient of variation of stock. B. is approwimately Step 3i. Practicet Expected fleturns Now it's time for you to practice what you've learned. Consider the following two probability distributions of expected future returns for stocks A and B. The expiected rate of retum for stock of is approximately Suppose you know that the standard devation of expected returms for stock B is 16.2776 Mh and would thm to caiciate me stanaard beviation of expectud retums for stock Hint Recall that the expected rate of return for stock A is 9.6% The variance' of the expected returns for atock A is approximately whlle the standard deviation of expecied returns for stock. A is opproximately Using your calculations in the previous parts of the probiem, the coefficient of variation of stock B is approximatelv Frue or Falsei Investors will always view the stock with a lower coefficlent of variation as a "safer" choice when cornpared to a stock with a highes oefficient of variation. True False Ose the cable to match each definifien weh the cerrect term. Reval the following passage of text and atswer the questions that follow. There are a few fundomental concepts wheh first learning to assess and anatyre an invevement's risks - both in isolatban and as part of a. portfolio, One such concept is that of a probability distribution, which outlines possible outcomes aiong with the probablity of that outcome occurring. Using. such a distribution, you can then estimate a probabaity-weighted average known as an expected value. In the context of an unestment, this could be used to calculate an expected rate of return for an investment, or a probability weighted average return, based on the probability of varieus retures being realired. While the expected returns from an investment is useful, it does not tell the whole story with regards to the risk of that investrvent. While thern are many definitions of risk, one simple measure of stand-alone risk can be calculated from the probabuity disuibution of the investment retums. For example, you can use the standard deviation to measure how tight, or how spread out, the probabilty distribution is around the expected value. An investment with a high standard deviation of expected retums will have a probability distribution that is more spread out, implying the the probatbility of the realized return being different than the expected (probability-weighted) return is higher, Conversely, when the standard feviation is low, the probability of the realized return of the investment being much different than the expected return is iow. returns beino realized. are many definitions of risk, one-simple measure of/ stand-alore risk can be catculated from the probability eistributon of the investment returns For example, you can use the stondard deviation to measure how tight, or how spread out, the probability disthbution is around tre expected value. An investment with a high standard deviation of expected returns will have a probability distnbution thot is more spiresd out, implying that the probability of the realized return being different than the expected (propability-weighted) return is higher, Conversely, when the standard deviation is low, the probability of the realized return of the ifvestment bing much aifferent than the expected return is iow. In the next stage of this problem, you will learn how to calculate both the expected return and standard deviation of expected returms for a pair of investments. True or False: The standard deviation of expected returns of a stock is one measure of the standalone risk of a stock. True Fatse Step 2i Learn It: Expected Returns Calculating and interpreting expected returns is critical in the field of finance. Watch the following video and answer the questions that follow: Suppose you know that the expected rate of return for stock A is. 1.2% and wowld like to calculate the expected return for stock B. For each row in the table, indicate the approximate vafule of product of the rate of retum for stock B multipied by the prabability of that retur Using your answers from the previous part of the question, the expected rate of return for stock B is approximately Using your answers from the previous part of the aumsion, the eapected fate of retur expected returns for stock-A. return and the expected rate of return for stocki. the standard deviation of expected returns for stack A is approximately. 16. Let o represent the standard deviation of a stock's feturns and r represent the expected returns of that stock. The formula for calculating the coefficient of variation for a stock's return is Uging this formula, along with your calculations in the Using your answers from the previous port of the question, the variahce of the expected returns for stock A is approwitnatelv the standard deviation of expected returns for stock A is pporcximecily Let fepresent the standard deviation of a stock's returns and f represent the expected returns of that stock. The formula for calculating the coefficient of variation for a stock's return is Using this formulo, along with your calculations in the previoua parts of the problem, the coefficient of variation of stock. B. is approwimately Step 3i. Practicet Expected fleturns Now it's time for you to practice what you've learned. Consider the following two probability distributions of expected future returns for stocks A and B. The expiected rate of retum for stock of is approximately Suppose you know that the standard devation of expected returms for stock B is 16.2776 Mh and would thm to caiciate me stanaard beviation of expectud retums for stock Hint Recall that the expected rate of return for stock A is 9.6% The variance' of the expected returns for atock A is approximately whlle the standard deviation of expecied returns for stock. A is opproximately Using your calculations in the previous parts of the probiem, the coefficient of variation of stock B is approximatelv Frue or Falsei Investors will always view the stock with a lower coefficlent of variation as a "safer" choice when cornpared to a stock with a highes oefficient of variation. True False
