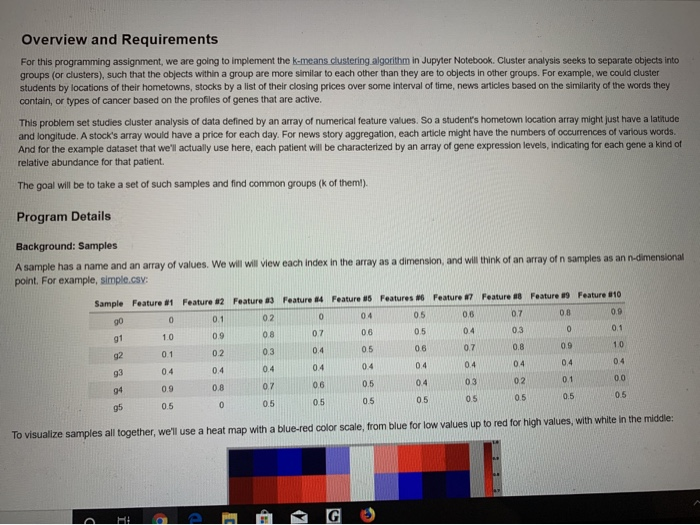
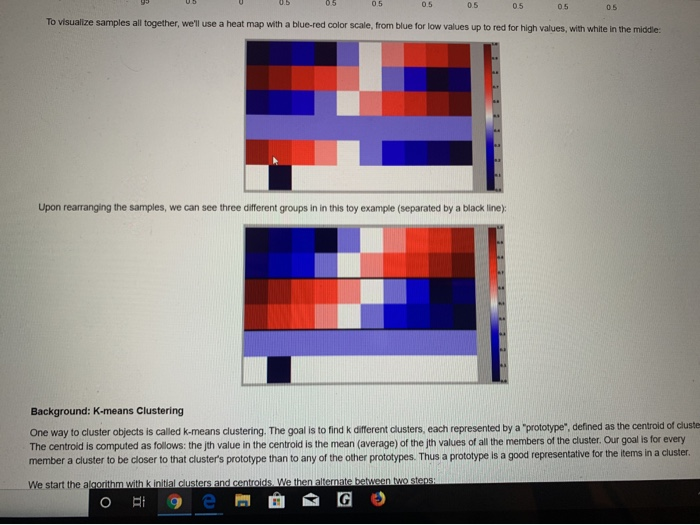
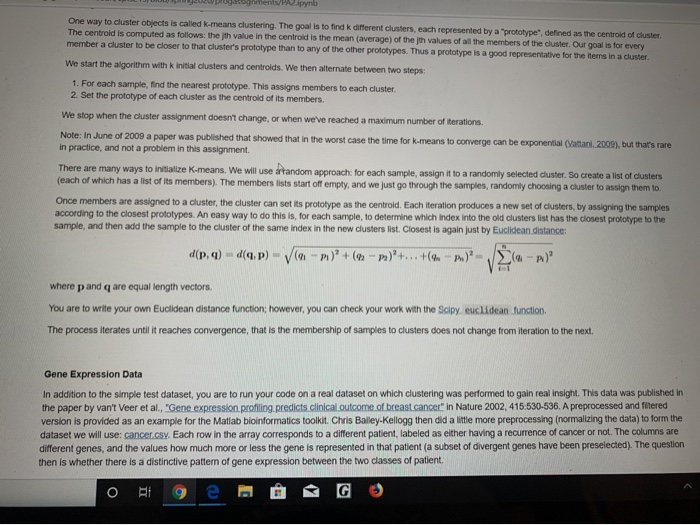
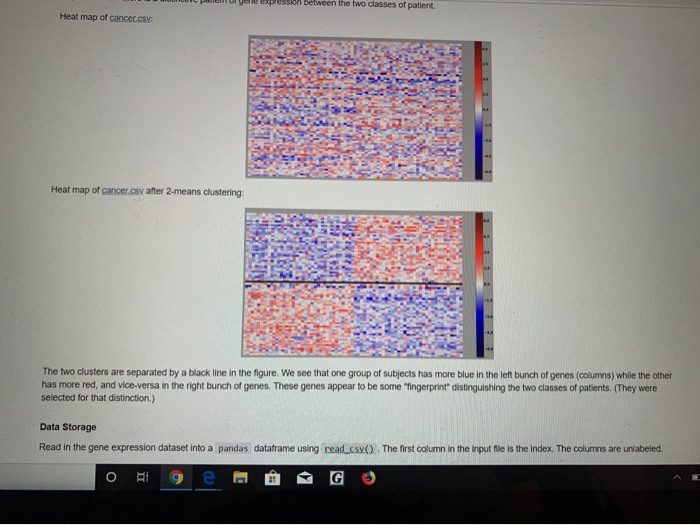
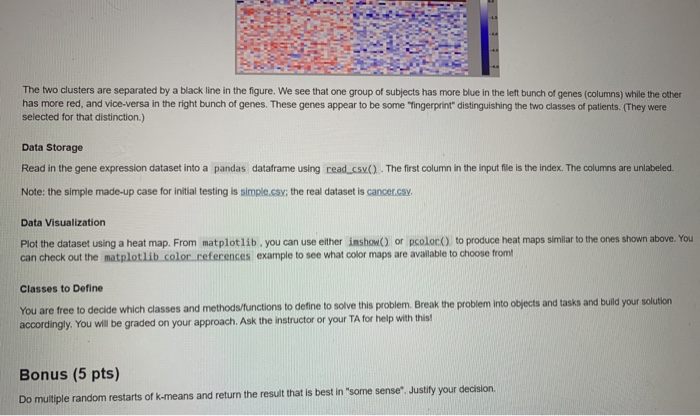
Overview and Requirements For this programming assignment, we are going to implement the k-means clustering algorithm in Jupyter Notebook. Cluster analysis seeks to separate objects into groups (or clusters), such that the objects within a group are more similar to each other than they are to objects in other groups. For example, we could cluster students by locations of their hometowns, stocks by a list of their closing prices over some interval of time, news articles based on the similarity of the words they contain, or types of cancer based on the profiles of genes that are active. This problem set studies cluster analysis of data defined by an array of numerical feature values. So a student's hometown location array might just have a latitude and longitude. A stock's array would have a price for each day. For news story aggregation, each article might have the numbers of occurrences of various words. And for the example dataset that we'll actually use here, each patient will be characterized by an array of gene expression levels, indicating for each gene a kind of relative abundance for that patient. The goal will be to take a set of such samples and find common groups (k of them!). Program Details Background: Samples A sample has a name and an array of values. We will will view each index in the array as a dimension, and will think of an array of n samples as an n dimensional point. For example, simple.csv: Sample Feature Feature 2 Feature 3 Feature 84 Feature 05 Features Feature Feature Feature 39 Feature 010 05 g00 0.1 10 05 00 00 05 05 0.5 0 To visualize samples all together, we'll use a heat map with a blue-red color scale, from blue for low values up to red for high values, with white in the middle: 85 0.5 0.5 0.5 0.5 05 05 To visualize samples all together, we'll use a heat map with a blue-red color scale, from blue for low values up to red for high values, with white in the middle: Upon rearranging the samples, we can see three different groups in in this toy example (separated by a black line) Background: K-means Clustering One way to cluster objects is called k-means clustering. The goal is to find k different clusters, each represented by a "prototype" defined as the centroid of cluste The centroid is computed as follows: the ith value in the centroid is the mean (average of the ith values of all the members of the cluster. Our goal is for every member a cluster to be closer to that cluster's prototype than to any of the other prototypes. Thus a prototype is a good representative for the items in a cluster We start the algorithm with kinitial clusters and centroids. We then alternate between two steps: o Eto e @ G Ag e ntspynb One way to cluster objects is called k-means clustering. The goal is to find k different clusters, each represented by a "prototype" defined as the centroid of cluster The centroid is computed as follows: theth value in the centroid is the mean (average) of the th values of all the members of the cluster. Our goal is for every member a cluster to be closer to that cluster's prototype than to any of the other prototypes. Thus a prototype is a good representative for the items in a cluster. We start the algorithm with k initial clusters and centroids. We then alternate between two steps: 1. For each sample, find the nearest prototype. This assigns members to each cluster. 2. Set the prototype of each cluster as the centroid of its members We stop when the cluster assignment doesn't change, or when we've reached a maximum number of iterations. Note: In June of 2009 a paper was published that showed that in the worst case the time for k-means to converge can be exponential (Vattani, 2009), but that's rare in practice, and not a problem in this assignment. There are many ways to initialize K-means. We will use random approach: for each sample, assign it to a randomly selected cluster. So create a list of clusters (each of which has a list of its members). The members lists start off empty, and we just go through the samples, randomly choosing a cluster to assign them to Once members are assigned to a cluster, the cluster can set its prototype as the centroid. Each iteration produces a new set of clusters, by assigning the samples according to the closest prototypes. An easy way to do this is for each sample, to determine which index into the old clusters list has the closest prototype to the sample, and then add the sample to the cluster of the same index in the new clusters list. Closest is again just by Euclidean distance: d(P.1) (p) )+ ( P)+...+(- ) where p and q are equal length vectors. You are to write your own Euclidean distance function; however, you can check your work with the Sony euclidean function The process iterates until it reaches convergence, that is the membership of samples to clusters does not change from iteration to the next. Gene Expression Data In addition to the simple test dataset, you are to run your code on a real dataset on which clustering was performed to gain real insight. This data was published in the paper by van't Veer et al., "Gene expression profiling predicts clinical outcome of breast cancer in Nature 2002,415,530-536. A preprocessed and filtered version is provided as an example for the Matlab bioinformatics toolkit Chris Bailey Kellogg then did a little more preprocessing (normalizing the data) to form the dataset we will use: cancer.csv. Each row in the array corresponds to a different patient, labeled as either having a recurrence of cancer or not. The columns are different genes, and the values how much more or less the gene is represented in that patient (a subset of divergent genes have been preselected). The question then is whether there is a distinctive pattern of gene expression between the two classes of patient. og e PG R e tween the two classes of patient. Heat map of cancer.cs: Heat map of cancer.csv after 2-means clustering: The two clusters are separated by a black line in the figure. We see that one group of subjects has more blue in the left bunch of genes (columns) while the other has more red, and vice-versa in the right bunch of genes. These genes appear to be some fingerprint distinguishing the two classes of patients. (They were selected for that distinction.) Data Storage Read in the gene expression dataset into a pandas dataframe using read_cs (). The first column in the input file is the index. The columns are unlabeled ORA 9e @ G The two clusters are separated by a black line in the figure. We see that one group of subjects has more blue in the left bunch of genes (columns) while the other has more red, and vice-versa in the right bunch of genes. These genes appear to be some "ingerprint distinguishing the two classes of patients. (They were selected for that distinction.) Data Storage Read in the gene expression dataset into a pandas dataframe using read_csx(). The first column in the input file is the index. The columns are unlabeled. Note: the simple made-up case for initial testing is simple.csv: the real dataset is cancer.cs. Data Visualization Plot the dataset using a heat map. From matplotlib, you can use either inshow() or pcolor to produce heat maps similar to the ones shown above. You can check out the matplotlib color references example to see what color maps are available to choose from Classes to Define You are free to decide which classes and methods/functions to define to solve this problem. Break the problem into objects and tasks and build your solution accordingly. You will be graded on your approach. Ask the instructor or your TA for help with this! Bonus (5 pts) Do multiple random restarts of k-means and return the result that is best in "some sense". Justify your decision. Overview and Requirements For this programming assignment, we are going to implement the k-means clustering algorithm in Jupyter Notebook. Cluster analysis seeks to separate objects into groups (or clusters), such that the objects within a group are more similar to each other than they are to objects in other groups. For example, we could cluster students by locations of their hometowns, stocks by a list of their closing prices over some interval of time, news articles based on the similarity of the words they contain, or types of cancer based on the profiles of genes that are active. This problem set studies cluster analysis of data defined by an array of numerical feature values. So a student's hometown location array might just have a latitude and longitude. A stock's array would have a price for each day. For news story aggregation, each article might have the numbers of occurrences of various words. And for the example dataset that we'll actually use here, each patient will be characterized by an array of gene expression levels, indicating for each gene a kind of relative abundance for that patient. The goal will be to take a set of such samples and find common groups (k of them!). Program Details Background: Samples A sample has a name and an array of values. We will will view each index in the array as a dimension, and will think of an array of n samples as an n dimensional point. For example, simple.csv: Sample Feature Feature 2 Feature 3 Feature 84 Feature 05 Features Feature Feature Feature 39 Feature 010 05 g00 0.1 10 05 00 00 05 05 0.5 0 To visualize samples all together, we'll use a heat map with a blue-red color scale, from blue for low values up to red for high values, with white in the middle: 85 0.5 0.5 0.5 0.5 05 05 To visualize samples all together, we'll use a heat map with a blue-red color scale, from blue for low values up to red for high values, with white in the middle: Upon rearranging the samples, we can see three different groups in in this toy example (separated by a black line) Background: K-means Clustering One way to cluster objects is called k-means clustering. The goal is to find k different clusters, each represented by a "prototype" defined as the centroid of cluste The centroid is computed as follows: the ith value in the centroid is the mean (average of the ith values of all the members of the cluster. Our goal is for every member a cluster to be closer to that cluster's prototype than to any of the other prototypes. Thus a prototype is a good representative for the items in a cluster We start the algorithm with kinitial clusters and centroids. We then alternate between two steps: o Eto e @ G Ag e ntspynb One way to cluster objects is called k-means clustering. The goal is to find k different clusters, each represented by a "prototype" defined as the centroid of cluster The centroid is computed as follows: theth value in the centroid is the mean (average) of the th values of all the members of the cluster. Our goal is for every member a cluster to be closer to that cluster's prototype than to any of the other prototypes. Thus a prototype is a good representative for the items in a cluster. We start the algorithm with k initial clusters and centroids. We then alternate between two steps: 1. For each sample, find the nearest prototype. This assigns members to each cluster. 2. Set the prototype of each cluster as the centroid of its members We stop when the cluster assignment doesn't change, or when we've reached a maximum number of iterations. Note: In June of 2009 a paper was published that showed that in the worst case the time for k-means to converge can be exponential (Vattani, 2009), but that's rare in practice, and not a problem in this assignment. There are many ways to initialize K-means. We will use random approach: for each sample, assign it to a randomly selected cluster. So create a list of clusters (each of which has a list of its members). The members lists start off empty, and we just go through the samples, randomly choosing a cluster to assign them to Once members are assigned to a cluster, the cluster can set its prototype as the centroid. Each iteration produces a new set of clusters, by assigning the samples according to the closest prototypes. An easy way to do this is for each sample, to determine which index into the old clusters list has the closest prototype to the sample, and then add the sample to the cluster of the same index in the new clusters list. Closest is again just by Euclidean distance: d(P.1) (p) )+ ( P)+...+(- ) where p and q are equal length vectors. You are to write your own Euclidean distance function; however, you can check your work with the Sony euclidean function The process iterates until it reaches convergence, that is the membership of samples to clusters does not change from iteration to the next. Gene Expression Data In addition to the simple test dataset, you are to run your code on a real dataset on which clustering was performed to gain real insight. This data was published in the paper by van't Veer et al., "Gene expression profiling predicts clinical outcome of breast cancer in Nature 2002,415,530-536. A preprocessed and filtered version is provided as an example for the Matlab bioinformatics toolkit Chris Bailey Kellogg then did a little more preprocessing (normalizing the data) to form the dataset we will use: cancer.csv. Each row in the array corresponds to a different patient, labeled as either having a recurrence of cancer or not. The columns are different genes, and the values how much more or less the gene is represented in that patient (a subset of divergent genes have been preselected). The question then is whether there is a distinctive pattern of gene expression between the two classes of patient. og e PG R e tween the two classes of patient. Heat map of cancer.cs: Heat map of cancer.csv after 2-means clustering: The two clusters are separated by a black line in the figure. We see that one group of subjects has more blue in the left bunch of genes (columns) while the other has more red, and vice-versa in the right bunch of genes. These genes appear to be some fingerprint distinguishing the two classes of patients. (They were selected for that distinction.) Data Storage Read in the gene expression dataset into a pandas dataframe using read_cs (). The first column in the input file is the index. The columns are unlabeled ORA 9e @ G The two clusters are separated by a black line in the figure. We see that one group of subjects has more blue in the left bunch of genes (columns) while the other has more red, and vice-versa in the right bunch of genes. These genes appear to be some "ingerprint distinguishing the two classes of patients. (They were selected for that distinction.) Data Storage Read in the gene expression dataset into a pandas dataframe using read_csx(). The first column in the input file is the index. The columns are unlabeled. Note: the simple made-up case for initial testing is simple.csv: the real dataset is cancer.cs. Data Visualization Plot the dataset using a heat map. From matplotlib, you can use either inshow() or pcolor to produce heat maps similar to the ones shown above. You can check out the matplotlib color references example to see what color maps are available to choose from Classes to Define You are free to decide which classes and methods/functions to define to solve this problem. Break the problem into objects and tasks and build your solution accordingly. You will be graded on your approach. Ask the instructor or your TA for help with this! Bonus (5 pts) Do multiple random restarts of k-means and return the result that is best in "some sense". Justify your decision
