Question
Overview: Financial analysis involves examining historical data to gain information about the current and future financial health of a company. Financial analysis can be applied
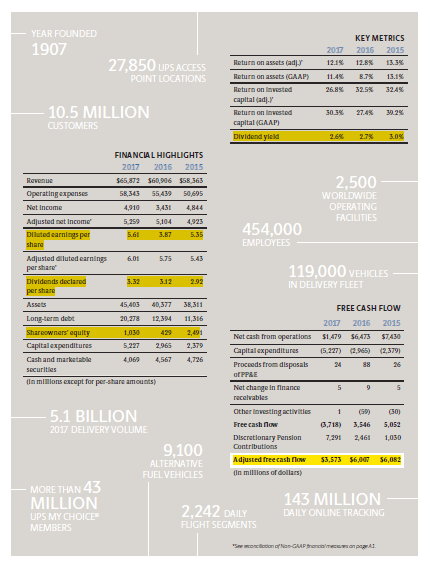
Overview: Financial analysis involves examining historical data to gain information about the current and future financial health of a company. Financial analysis can be applied in a wide variety of situations to give business managers the information they need to make critical decisions. The ability to understand financial data is essential for any business manager. For the final project, you will use financial information from the provided 2017 United Parcel Service Annual Report to prepare a financial analysis. You will include in your analysis the background calculations and managerial analysis for each of the following topics: time value of money, stock and bond valuation, and capital budgeting. You will also discuss macroeconomic variables that might impact the companys financial decision making and strategic objectives. These topics will be covered over four milestones to be submitted throughout the course before you submit the final project. Note that while these elements may seem separate and unrelated, together they will present a well-rounded view of the companys finances with regard to the topics. For this milestone, you will submit a draft of the Time Value of Money section of the final project along with your supporting explanations as detailed below. Prompt: Calculate time value of money figures and use the results to support your explanations of the present and future value of United Parcel Service. Complete your calculations on the designated tab in the Final Project Excel Workbook. Create a separate Word document for your justifications. Specifically, the following critical elements must be addressed: I. Time Value of Money A. Using the Final Project Excel Workbook, compute the following time value of money figures: 1. Calculate the present value of the company based on the given interest rate and provided Free Cash Flows for the years 2015, 2016, and 2017. 2. Suppose the risk of the company changes based on an unanticipated decrease in the Free Cash Flows by 10% annually during the years 2015, 2016, and 2017. Recalculate the present value of the company. 3. Suppose that a potential buyer has offered to buy this company in three years. Based on the initial present value you calculated above in A1, what would be a reasonable amount for the buyer to pay for the company in three years time? Enter your answer and justify your reasoning in the Word document. B. What are the implications of the change in present value based on risk? In other words, what does the change mean to the company, and how would you, as a financial manager, interpret it? Be sure to justify your reasoning with appropriate references/sources. Enter your answer and justify your reasoning in the Word document. C. Based on the present value of the company that you calculated, and being mindful of the need to effectively balance portfolio risk with return, what recommendation would you make about purchasing the company as an investment at that price? Be sure to substantiate your reasoning with appropriate references/sources. Enter your answer and justify your reasoning in the Word document. Rubric Guidelines for Submission: Submit your Final Project Excel Worksheet with the required calculations completed. Submit your written paper as a separate Microsoft Word Document 
Step by Step Solution
There are 3 Steps involved in it
Step: 1

Get Instant Access to Expert-Tailored Solutions
See step-by-step solutions with expert insights and AI powered tools for academic success
Step: 2

Step: 3

Ace Your Homework with AI
Get the answers you need in no time with our AI-driven, step-by-step assistance
Get Started


