Answered step by step
Verified Expert Solution
Question
1 Approved Answer
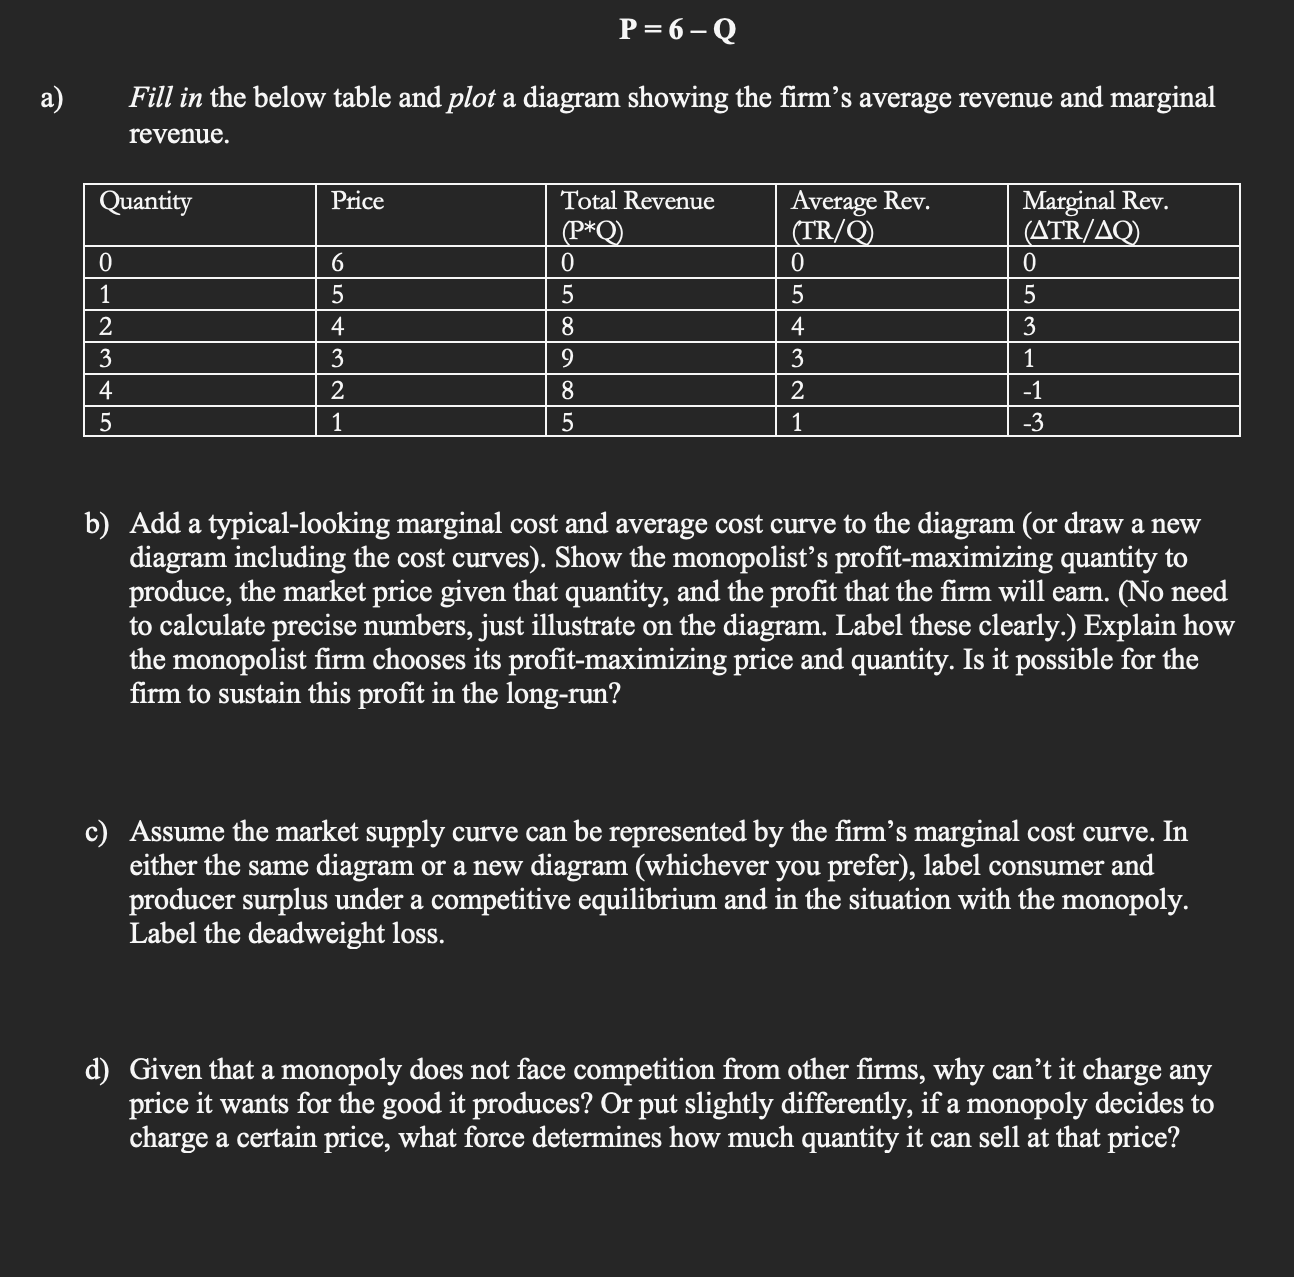
P = 6 - Q a ) Fill in the below table and plot a diagram showing the firm's average revenue and marginal revenue. b
a Fill in the below table and plot a diagram showing the firm's average revenue and marginal
revenue.
b Add a typicallooking marginal cost and average cost curve to the diagram or draw a new
diagram including the cost curves Show the monopolist's profitmaximizing quantity to
produce, the market price given that quantity, and the profit that the firm will earn. No need
to calculate precise numbers, just illustrate on the diagram. Label these clearly. Explain how
the monopolist firm chooses its profitmaximizing price and quantity. Is it possible for the
firm to sustain this profit in the longrun?
c Assume the market supply curve can be represented by the firm's marginal cost curve. In
either the same diagram or a new diagram whichever you prefer label consumer and
producer surplus under a competitive equilibrium and in the situation with the monopoly.
Label the deadweight loss.
d Given that a monopoly does not face competition from other firms, why can't it charge any
price it wants for the good it produces? Or put slightly differently, if a monopoly decides to
charge a certain price, what force determines how much quantity it can sell at that price?

Step by Step Solution
There are 3 Steps involved in it
Step: 1

Get Instant Access to Expert-Tailored Solutions
See step-by-step solutions with expert insights and AI powered tools for academic success
Step: 2

Step: 3

Ace Your Homework with AI
Get the answers you need in no time with our AI-driven, step-by-step assistance
Get Started


