Question
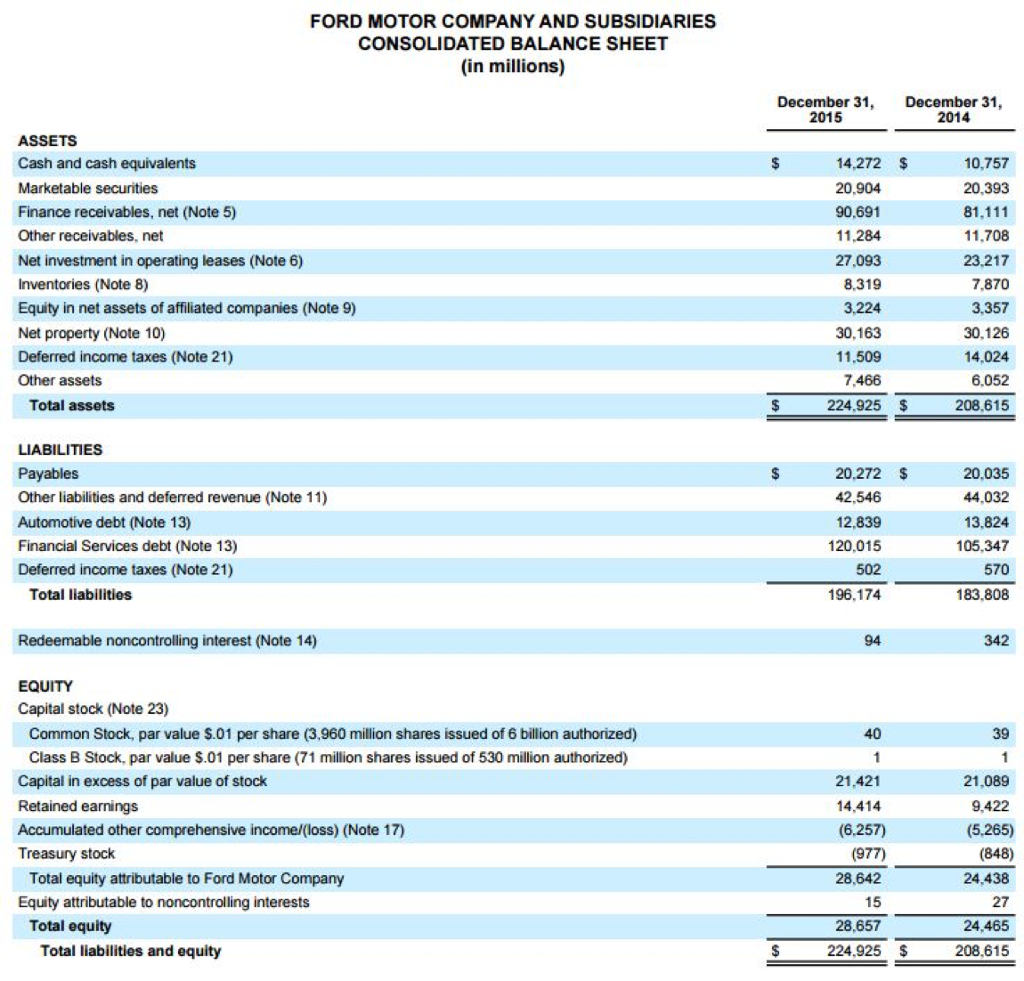
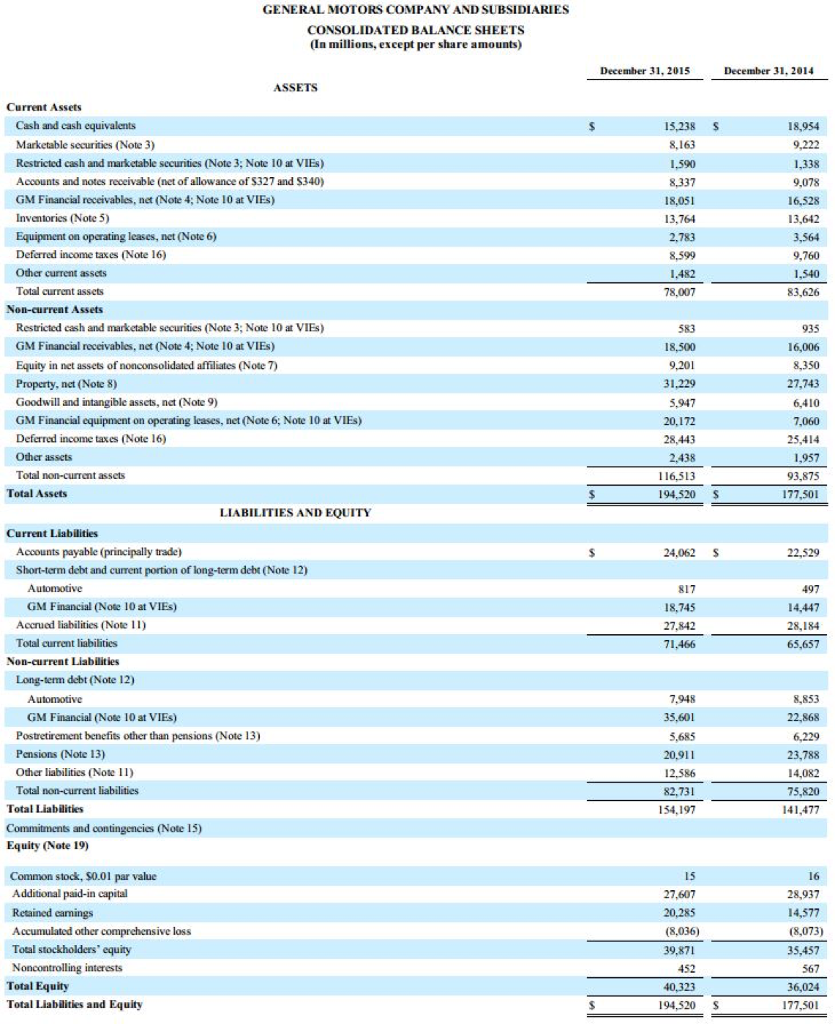
P lease review the above Balance Sheets for General Motors Company and Ford complete the table below by calculating the following ratios for each company


P
lease review the above Balance Sheets for General Motors Company and Ford complete the table below by calculating the following ratios for each company using the 12/31/15 numbers? Then, you are asked to determine which company has the better current ratio, debt ratio, and return on total assets ratio.
Please round your answers to 2 decimal places. Remember, the debt ratio and return on assets ratios are percentages. So, if your answer is .0654, then it needs to be entered as 6.54, which is 6.54%.
| Ford | General Motors | Which is better? | |
| Current Ratio | ______: 1 | _______: 1 | Select an answer Ford or GM |
| Debt Ratio | _______ % | ________% | Select an answer Ford or GM |
| Return on Assets | _______% | ________% | Select an answer Ford or GM |
Current Ratio
You'll need to calculate this by taking the 2015 Total Current Assets and dividing it by the Total Current Liabilities. Please round your answer to 2 decimal places.
Calculation of the Current Ratio of Ford is a bit more complicated since the financial statement doesn't break down current and long-term assets and liabilities. We could figure it, but I will save you the trouble and tell you that Ford's Current Ratio at the end of 2013 was 2.12. This tells you that they have $2.12 in current assets to every $1 in current liabilities. We usually prefer a ratio or 1.5 or better to 1. This is a measure of the company's ability to pay their short-term debt as they come due.
Debt Ratio
You'll need to calculate this by taking the 2015 Total Liabilities and dividing it by their 2015 Total Assets. You will then have to move the decimal place to the right 2 places to get a percentage. Please round your answer to 2 decimal places.
Which company has the higher Debt Ratio? This tells us how much of a company's assets are financed by debt. This indicates risk. The higher the debt ratio, the higher the risk.
Return on Assets
You'll need to calculate this by taking the 2015 Net Income and dividing it by their Average Total Assets. Average Total Assets will be calculated by taking the 2014 Ending Total Asset Balance and adding it to the 2015 Ending Total Asset Balance and divide the resulting number by 2. You will then have to move the decimal place to the right 2 places to get a percentage. Please round your answer to 2 decimal places.
This tells us how a good a company is at using the assets they have invested in the company to generate net income. A higher number indicates the company is doing a better job using they assets they have to generate net income.
Thank you for the assistance. It is greatly appreciated!!!!
FORD MOTOR COMPANY AND SUBSIDIARIES CONSOLIDATED BALANCE SHEET (in millions) ASSETS Cash and cash equivalents Marketable securities Finance receivables, net (Note 5) Other receivables. net Net investment in operating leases (Note 6) Inventories (Note 8) Equity in net assets of affiliated companies (Note 9) Net property (Note 100 Deferred income taxes (Note 21) Other assets Total assets LIABILITIES Payables Other liabilities and deferred revenue (Note 11) Automotive debt (Note 13) Financial Services debt (Note 13) Deferred income taxes (Note 21) Total liabilities Redeemable noncontrolling interest (Note 14) EQUITY Capital stock (Note 23) Class B Stock, par value $.01 per share (71 million shares issued of 530 million authorized) Capital in excess of par value of stock Retained earnings Accumulated other comprehensive income/(loss) (Note Treasury stock Total equity attributable to Ford Motor Company Equity attributable to noncontrolling interests Total equity Total liabilities and equity December 31. December 31 2015 2014 14,272 10,757 20.904 20,393 81.111 90.691 11,284 11.708 27.093 23.217 8.319 7.870 3,224 3.357 30.163 30.126 14.024 11.509 7.466 6.052 224,925 208.615 20.272 20.035 42.546 44.032 12,839 13.824 120.015 105.347 502 570 196.174 183.808 342 39 21.421 21,089 14.414 422 (6,257) (5,265) (977) (848) 28.642 24,438 15 27 28.657 24.465 224.925 208.615Step by Step Solution
There are 3 Steps involved in it
Step: 1

Get Instant Access to Expert-Tailored Solutions
See step-by-step solutions with expert insights and AI powered tools for academic success
Step: 2

Step: 3

Ace Your Homework with AI
Get the answers you need in no time with our AI-driven, step-by-step assistance
Get Started


