Answered step by step
Verified Expert Solution
Question
1 Approved Answer
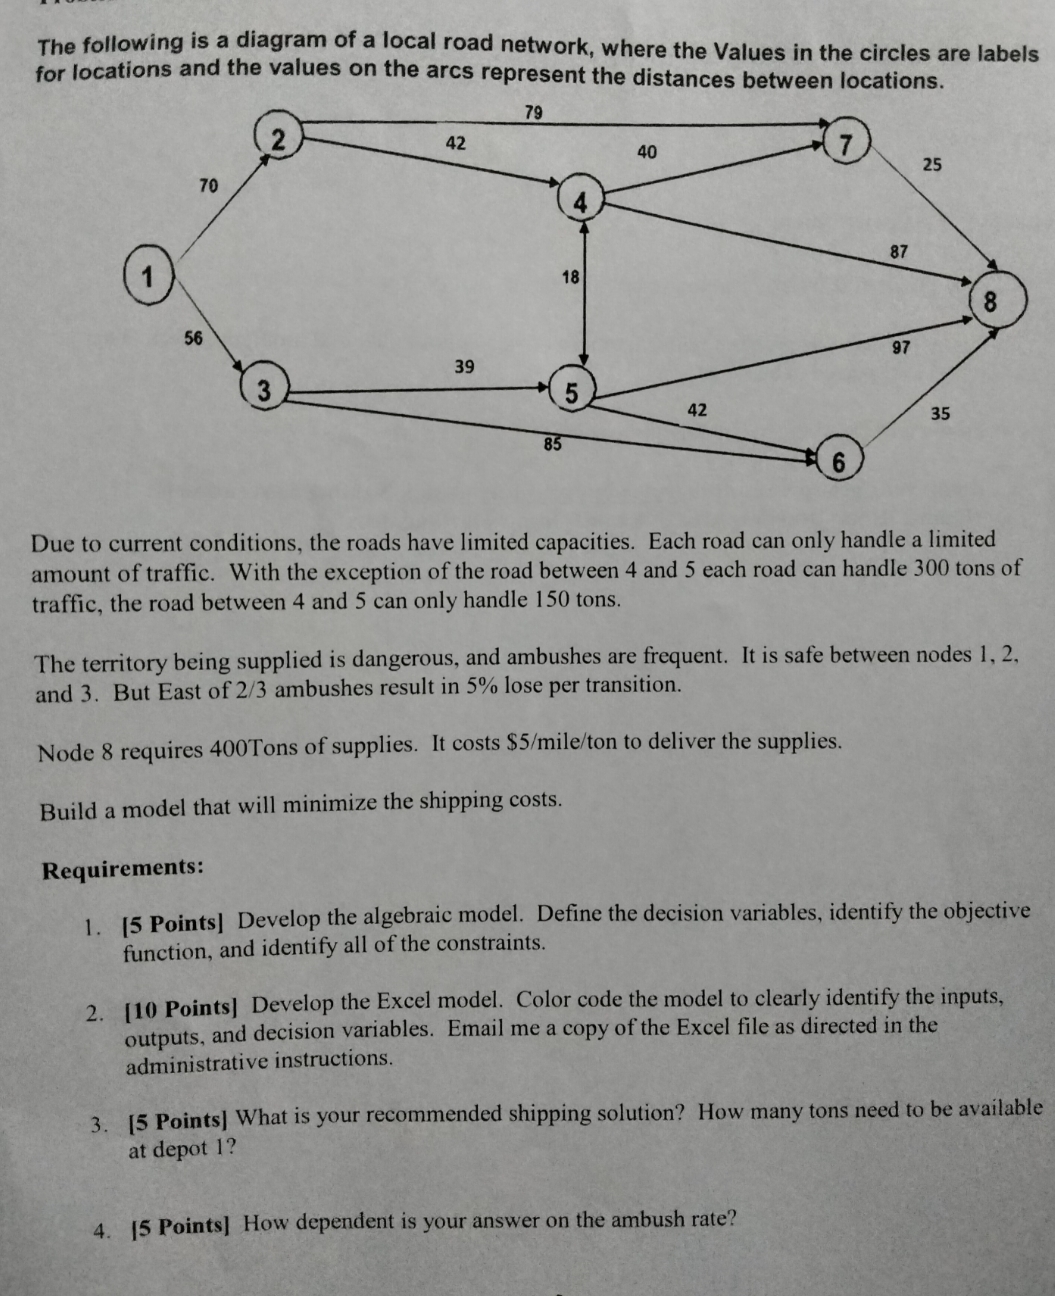
p The following is a diagram of a local road network, where the Values in the circles are labels for locations and the values on
p

The following is a diagram of a local road network, where the Values in the circles are labels for locations and the values on the arcs represent the distances between locations. 70 79 42 56 39 18 40 42 85 25 87 8 97 6 35 Due to current conditions, the roads have limited capacities. Each road can only handle a limited amount of traffic. With the exception of the road between 4 and 5 each road can handle 300 tons of traffic, the road between 4 and 5 can only handle 150 tons. The territory being supplied is dangerous, and ambushes are frequent. It is safe between nodes 1, 2, and 3. But East of 2/3 ambushes result in 5% lose per transition. Node 8 requires 400Tons of supplies. It costs $5/mile/ton to deliver the supplies. Build a model that will minimize the shipping costs. Requirements: 1. [5 Points] Develop the algebraic model. Define the decision variables, identify the objective function, and identify all of the constraints. 2. [10 Points] Develop the Excel model. Color code the model to clearly identify the inputs, outputs, and decision variables. Email me a copy of the Excel file as directed in the administrative instructions. 3. [5 Points] What is your recommended shipping solution? How many tons need to be available at depot 1? 4. 15 Points] How dependent is your answer on the ambush rate?
Step by Step Solution
There are 3 Steps involved in it
Step: 1

Get Instant Access to Expert-Tailored Solutions
See step-by-step solutions with expert insights and AI powered tools for academic success
Step: 2

Step: 3

Ace Your Homework with AI
Get the answers you need in no time with our AI-driven, step-by-step assistance
Get Started


