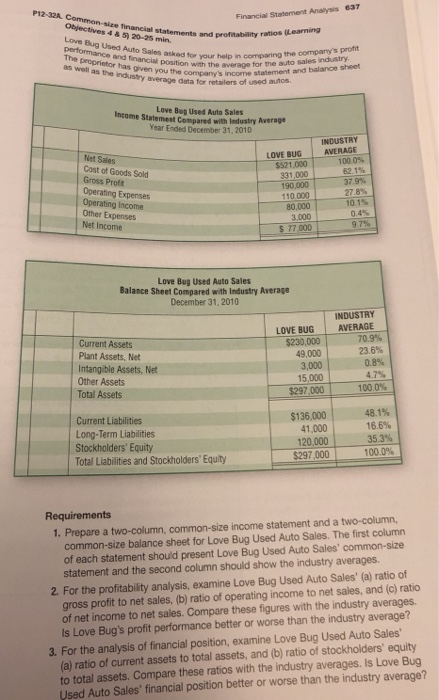
P12-32A Financial Statement Analysis 637 and profitability ratios (Learning Love n comparing the company's profit average for the auto sales industry ncome statement and balance sheet The as well has as the indussryen ou the company's i y average data for retailers of used autos Love Bug Used Auto Sales Income Statemest Compared with Industry Average Year Ended December 31,2010 INDUSTRY LOVE BUG I AVERAGE 100 0% 621% 37.9% 278% 10.1% 0 4% $521,000 331,000 90,000 110.000 80,000 3,000 Net Income 177,000- Love Bug Used Auto Sales Balance Sheet Compared with Industry Average December 31, 2010 INDUSTRY LOVE BUG I AVERAGE Current Assets Plant Assets, Net intangible Assets, Net Other Assets Total Assets 70.9% 23.6% 0.8% 47% 1000% $230,000 49,000 3,000 15,000 $297,000 I Current Liabilities 48.1% 16.6% 353% 100.0% $136,000 41,000 120,000 $297,000 Long-Term Liabilities Stockholders' Equity Total Liabilities and Stockholders Equity Requirements 1. Prepare a two-column, common-size income statement and a two-column, common-size balance sheet for Love Bug Used Auto Sales. The first column of each statement should present Love Bug Used Auto Sales' common-size statement and the second column should show the industry averages. 2. For the profitability analysis, examine Love Bug Used Auto Sales' (a) ratio of gross profit to net sales, (b) ratio of operating income to net sales, and (c) ratio of net income to net sales. Compare these figures with the industry averages. Is Love Bug's profit performance better or worse than the industry average? 3. For the analysis of financial position, examine Love Bug Used Auto Sales (a) ratio of current assets to total assets, and (b) ratio of stockholders' equity to total assets. Compare these ratios with the industry averages. Is Love Bug Used Auto Sales' financial position better or worse than the industry average