Answered step by step
Verified Expert Solution
Question
1 Approved Answer
P2-50 i need the andwer for its the data do you need all data for me to type it or just questions? second image is

P2-50 i need the andwer for

its the data do you need all data for me to type it or just questions? second image is visible or else i reposted question again. 
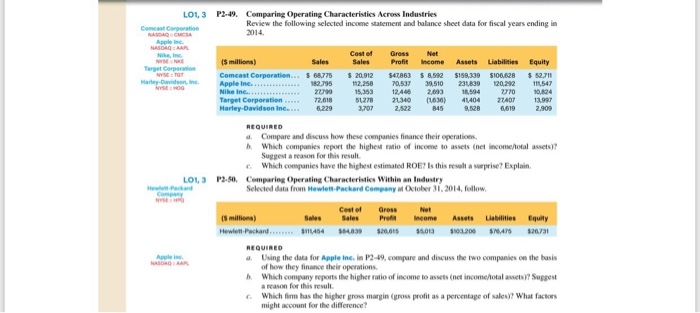
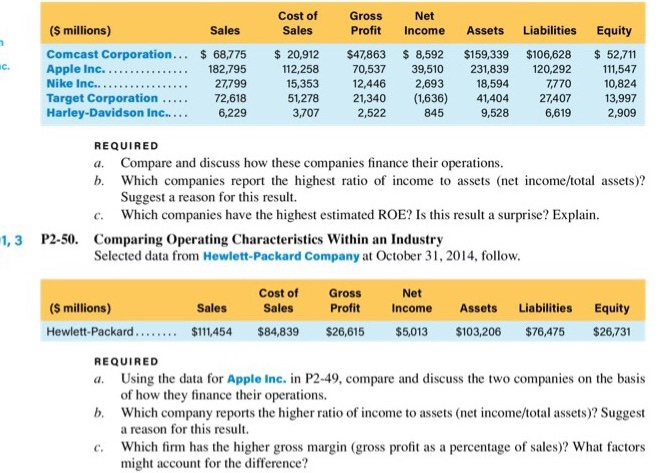
Cost of Net Gross (S millions) SalesSalesProfit Income Assets Liabilities Equity Comcast Corporation... 68,775 20,912 $47863 $8,592 $159,339 106,628 52,711 70,537 39,510 231,839 120,292 11,547 7770 10,824 c. 112,258 15,353 51,278 21,340 636 41,404 27407 13,997 12,446 2,693 18,594 Target Corporation.... Harley-Davidson Inc...6,229 3,707 2,522 845 9,528 6,619 2,909 REQUIRED a. Compare and discuss how these companies finance their operations. b. Which companies report the highest ratio of income to assets (net income/total assets)? Suggest a reason for this result Which companies have the highest estimated ROE? Is this result a surprise? Explain. Comparing Operating Characteristics Within an Industry Selected data from Hewlett-Packard Company at October 3,2014, follow. c. P2-50. 1,3 Net Sales Sales Profit Income Assets Liabilities Equity Cost of Gross (S millions) Hewlett-Packard$111,454 $84,839 $26,615 $5,013 $103,206 $76,475 $26,731 REQUIRED a. Using the data for Apple Inc. in P2-49, compare and discuss the two companies on the basis b. of how they finance their operations Which company reports the higher ratio of income to assets (net income/total assets)? Suggest a reason for this result. Which firm has the higher gross margin (gross profit as a percentage of sales)? What factors might account for the difference? c 
Step by Step Solution
There are 3 Steps involved in it
Step: 1

Get Instant Access to Expert-Tailored Solutions
See step-by-step solutions with expert insights and AI powered tools for academic success
Step: 2

Step: 3

Ace Your Homework with AI
Get the answers you need in no time with our AI-driven, step-by-step assistance
Get Started


