

Question
P.3.2 An ice cream shop offers a discount price on a small ice cream cone - the price is obtained by rolling two dice and
P.3.2
An ice cream shop offers a discount price on a small ice cream cone - the price is obtained by rolling two dice and then taking the larger number followed by the smaller number to be the price (in cents). So rolling a 3 and a 2, or a 2 and a 3, would result in a price of 32 cents. If I visit the ice cream shop with only 50 cents in my pocket, the probability that the ice cream cone costs no more than 50 cents is 4/9, which is about 0.444. How would you interpret this probability?
a. None of these choices correctly interprets this probability.
b. Among all customers who enter this ice cream shop tomorrow, about 4/9 will be able to afford the ice cream cone
c. If I go to this ice cream shop a very large number of times with only 50 cents each time, then I will be able to afford the ice cream cone in about 44.4% of all such visits.
d. I will be able to afford the ice cream cone in 4 of my next 9 visits to this shop, if I always enter with two quarters.
P.3.3
Which of the following numberscannot represent a probability? Select all that apply.
a. 88%
b. 107%
c. 27%
d. 0.01
e. -0.05
f. 1.05
Chapter P.2 Exercise Question 01
P.2.1
Suppose that Nellie records the highest temperature every day for one year in New York City, while Sandy does the same in San Diego.
Who would you expect to have the larger mean of these temperatures?
a. Sandy - temperatures in San Diego tend to be higher than in New York
b. It cannot be determined
c. They would be the same because they are both on the coasts
Nellie - New York has high temperatures similar to San Diego, just not as many
Who would you expect to have the larger standard deviation of these temperatures?
a. It cannot be determined
b. They would be the same
c. Nellie - because New York temperatures vary more throughout the year
d. Sandy - because San Diego temperatures do not vary as much as New York's
Chapter P.2 Exercise Question 03
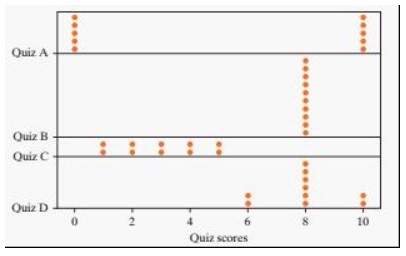
P.2.3
Consider the following four distributions of quiz scores for a class of 10 students:
Arrange these in order from smallest standard deviation to largest standard deviation.
Step by Step Solution
There are 3 Steps involved in it
Step: 1

Get Instant Access to Expert-Tailored Solutions
See step-by-step solutions with expert insights and AI powered tools for academic success
Step: 2

Step: 3
Ace Your Homework with AI
Get the answers you need in no time with our AI-driven, step-by-step assistance
Get Started
Calculus Early Transcendentals
Authors: James Stewart
7th edition
538497904, 978-0538497909