

Answered step by step
Verified Expert Solution
Question
1 Approved Answer
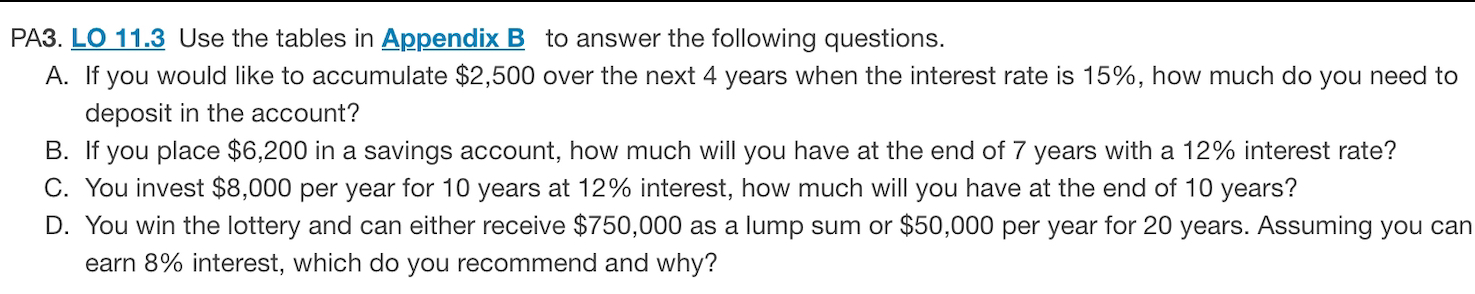
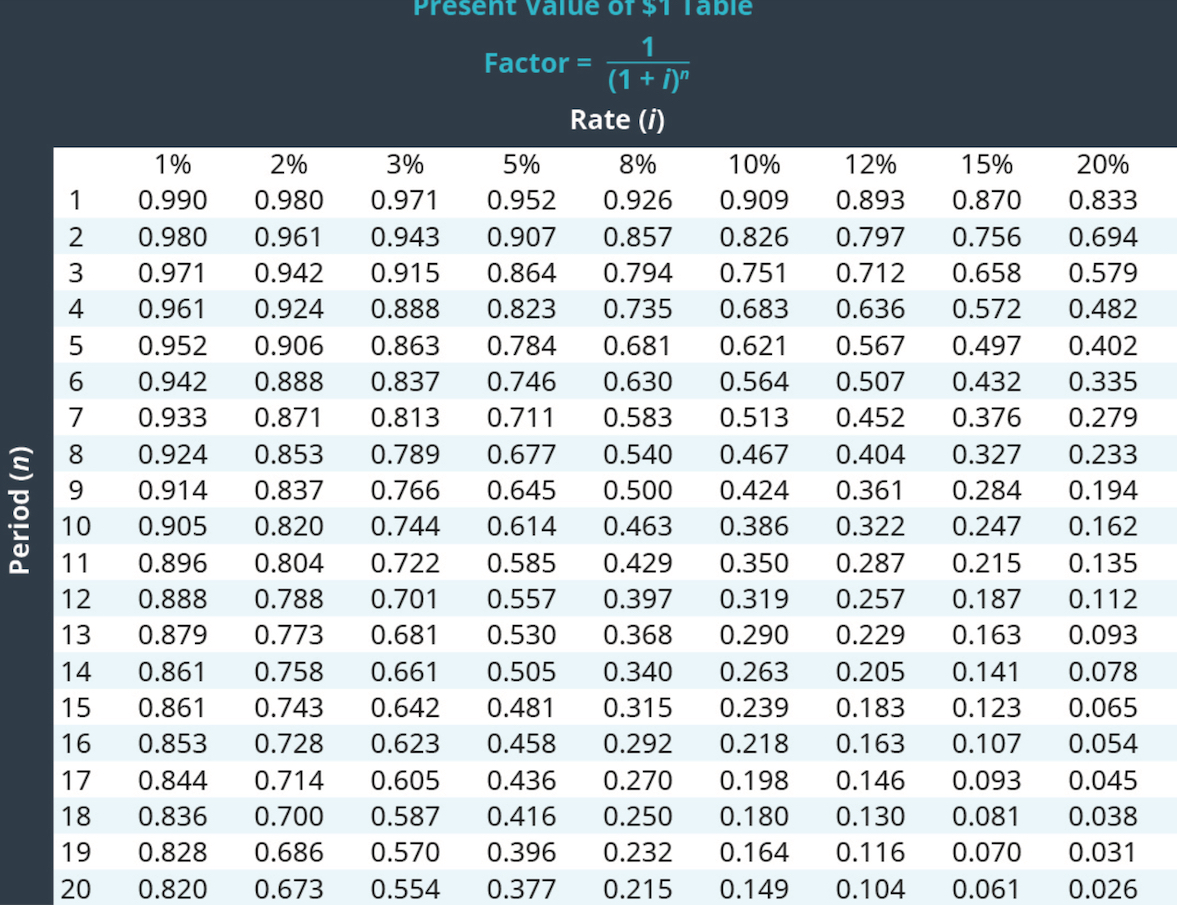
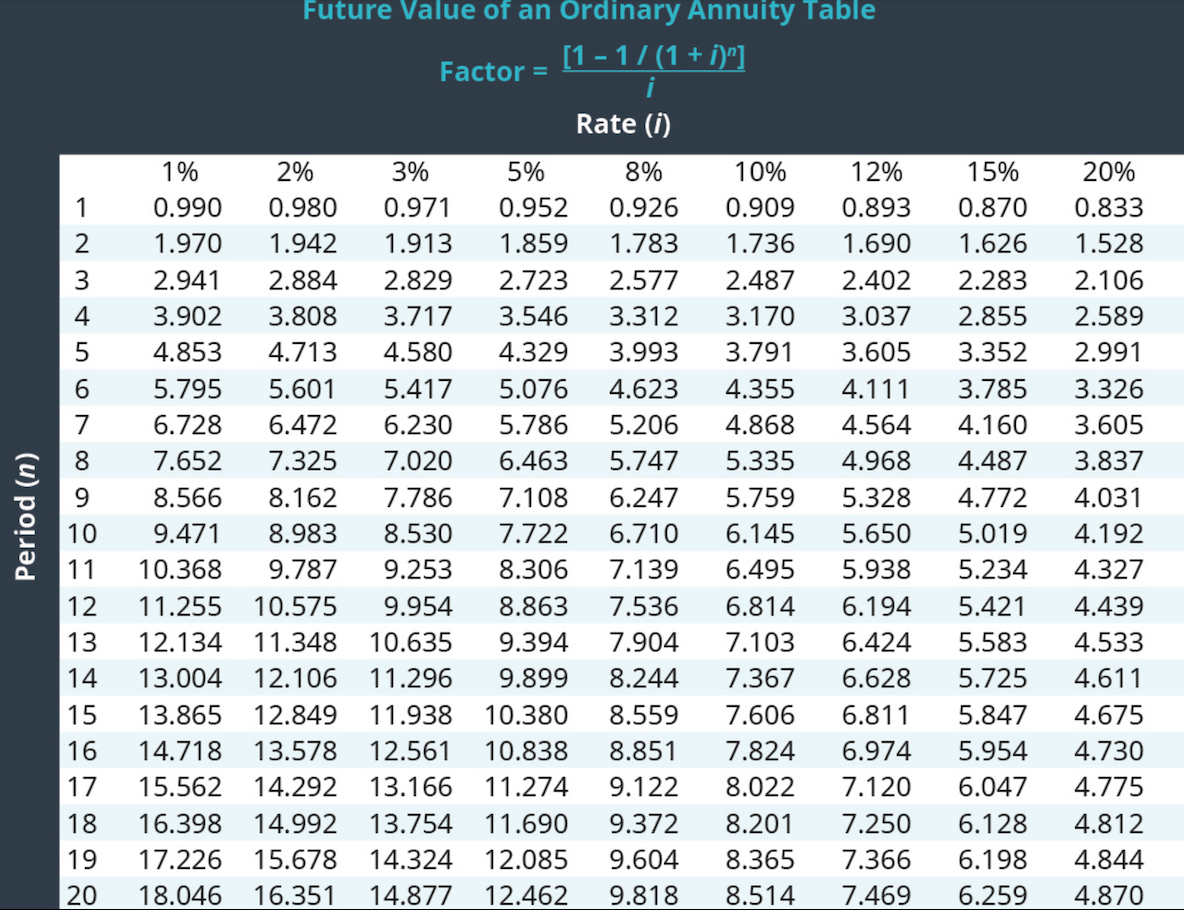
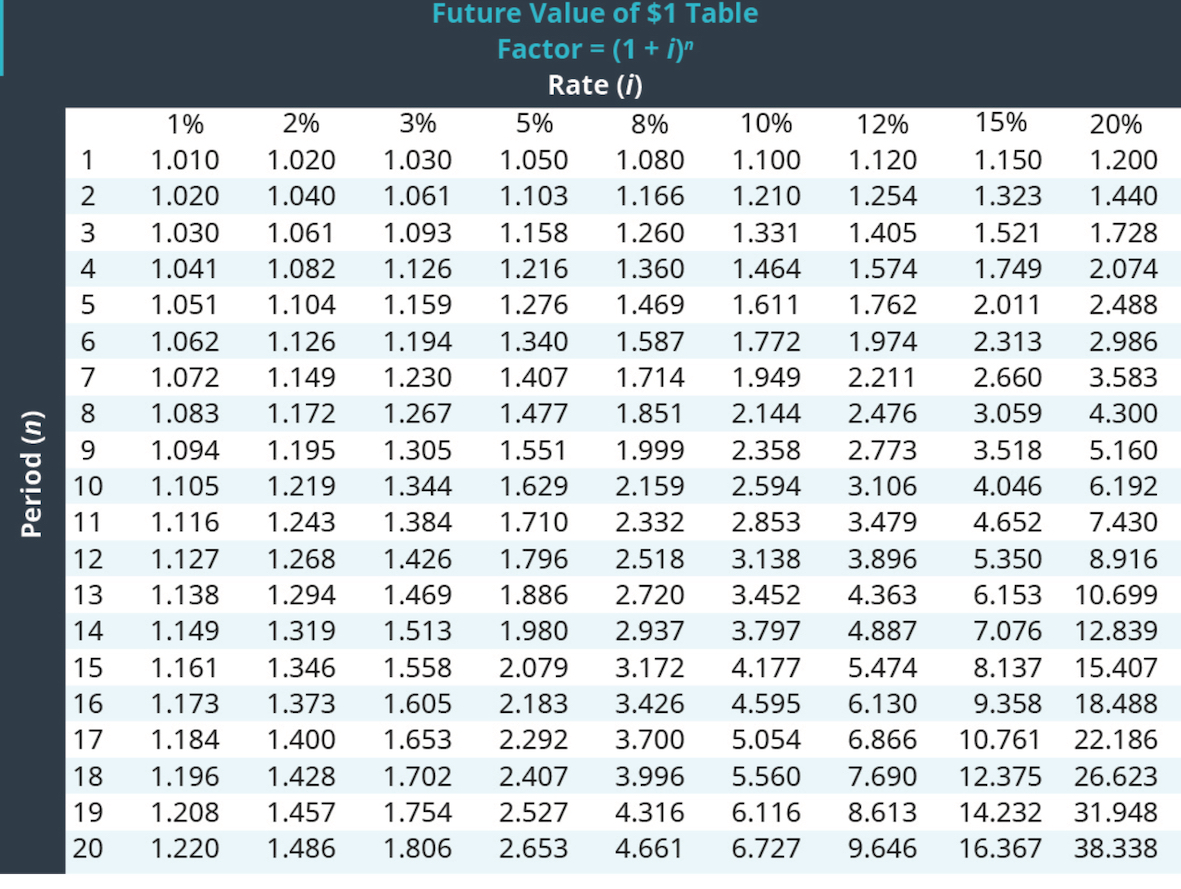
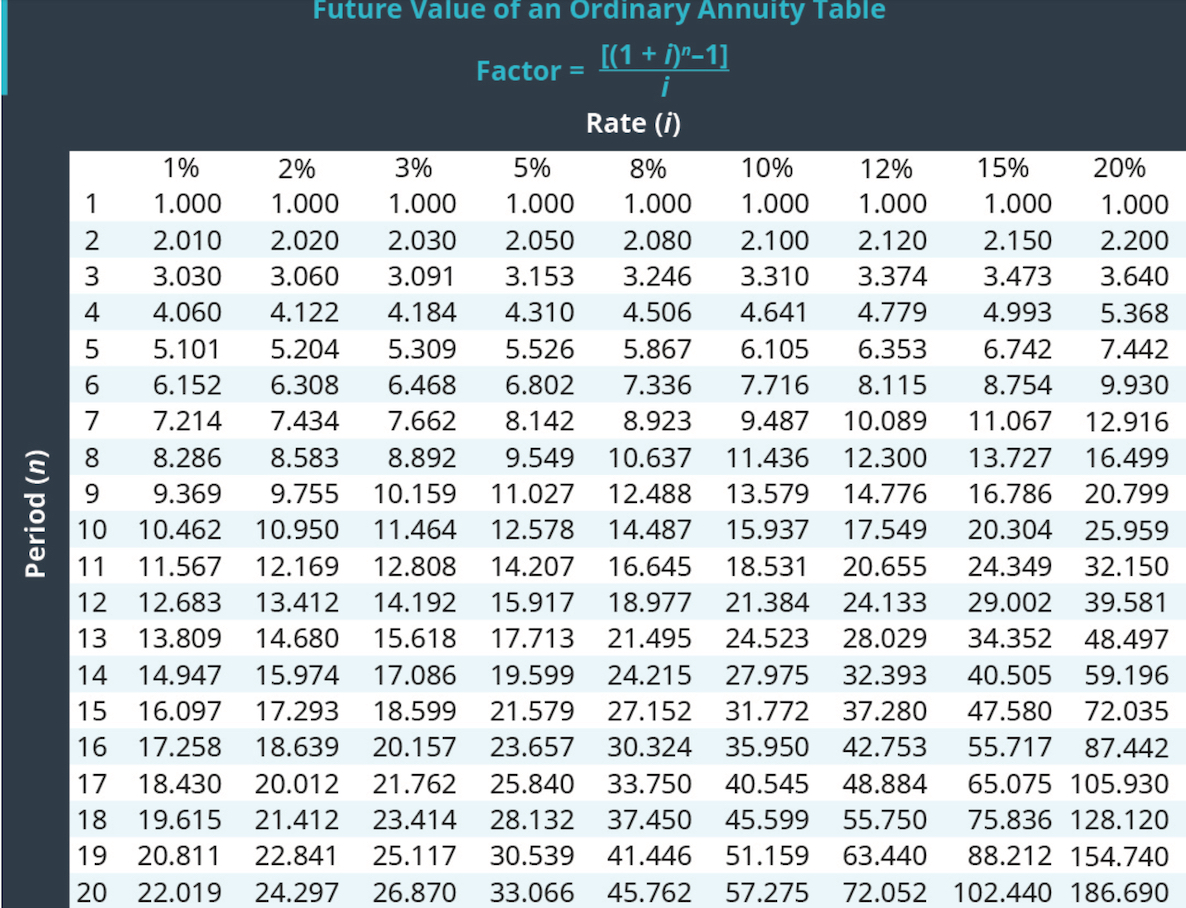
PA3. LO 11.3 Use the tables in Appendix B to answer the following questions. A. If you would like to accumulate $2,500 over the next
Step by Step Solution
There are 3 Steps involved in it
Step: 1

Get Instant Access to Expert-Tailored Solutions
See step-by-step solutions with expert insights and AI powered tools for academic success
Step: 2

Step: 3
Ace Your Homework with AI
Get the answers you need in no time with our AI-driven, step-by-step assistance
Get Started
Sm Auditing Integrated Appr Review Copy
Authors: ARENS LO, EBBECKE
7th Edition
0135914396, 978-0135914397