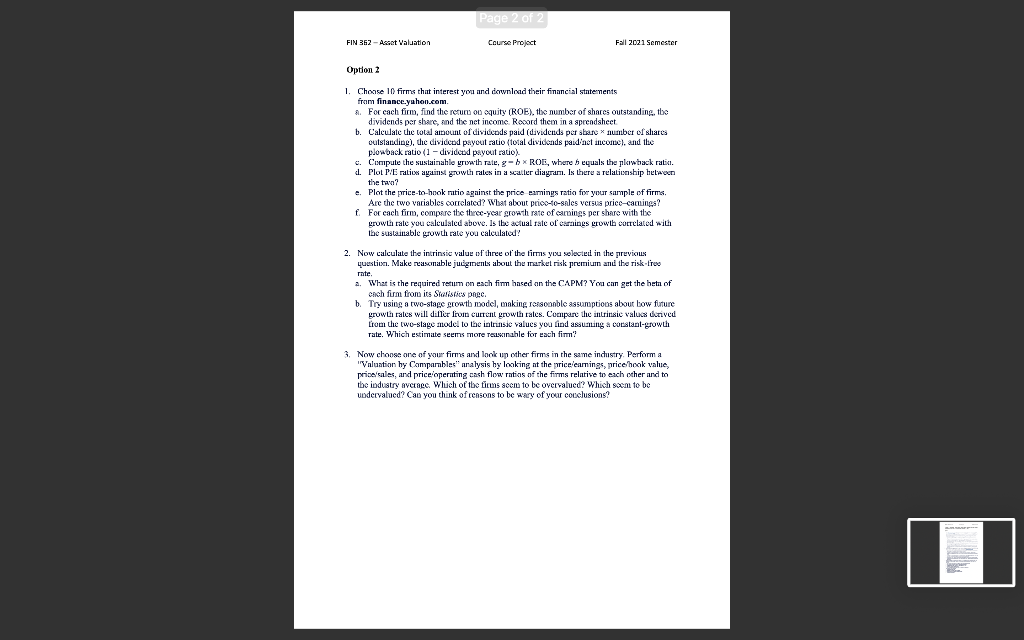
Page 2 of 2 FIN 352-Aaset Valuation Course Project Fall 2021 Semester Option 2 1. Choose 10 firms that interest you and download their financial statements from finance.yahoo.com a. Forcach firm, find the return on equity (ROE), the number of shares outstanding, the dividends per share, and the net income Record them in a spreadsheet b. Calculate the total amount of dividends paid (dividends per sbare number of shares outstanding), the dividend payout ratio (total dividends pa d'act income, and the plowback ratio (1 - dividcod payout ratio) c. Compute the sustainable yriyath rate, goh ROE, where b equals the powback ratici. d. Plot PE ralis against growth rates in a caller diagram. Is there a relationship hetween the tax? .. Plot the price-to-book ratio against the price earnings ratio for your sample of firms. Are the two variables correlated? What about prioc-to-sales versus price-camnings? f. For each firm, compare the three-year growth rate of camings per share with the growth rate you calculated above. Is the actual rate of earnings growth correlated with the sustainable growth rate you calculatod! 2. Now calculate the intrinsic value of three of the firms you selected in the previous questiva. Make reasonable juegments about the market risk premium and the risk-free . rate 2. What is the required return on each firm based on the CAPM? You can get the beta of cach firm from its Statistics page b. Try using a two-stage growth model, making ressconblc assumptious about bow future a , grow rates will deler lion current growth rates. Compare the intrinsic value drived from the two-stage model to the intruse values you find assuzuing a constant-growth rate. Which estimate seems more to inable for each fimm 3. Now choose one of your firms and look up other firms in the same inchustry Performa "Valuation hy Comparbles" analysis hy looking at the priceleamings, price hook value, price'sales, and price operating cash flow ratios of the firms relative to each other and to the industry averace. Which of the firums seem to be overvalued? Which seem to be undervalued? Can you think of reasons to be wary of your conclusions? Page 2 of 2 FIN 352-Aaset Valuation Course Project Fall 2021 Semester Option 2 1. Choose 10 firms that interest you and download their financial statements from finance.yahoo.com a. Forcach firm, find the return on equity (ROE), the number of shares outstanding, the dividends per share, and the net income Record them in a spreadsheet b. Calculate the total amount of dividends paid (dividends per sbare number of shares outstanding), the dividend payout ratio (total dividends pa d'act income, and the plowback ratio (1 - dividcod payout ratio) c. Compute the sustainable yriyath rate, goh ROE, where b equals the powback ratici. d. Plot PE ralis against growth rates in a caller diagram. Is there a relationship hetween the tax? .. Plot the price-to-book ratio against the price earnings ratio for your sample of firms. Are the two variables correlated? What about prioc-to-sales versus price-camnings? f. For each firm, compare the three-year growth rate of camings per share with the growth rate you calculated above. Is the actual rate of earnings growth correlated with the sustainable growth rate you calculatod! 2. Now calculate the intrinsic value of three of the firms you selected in the previous questiva. Make reasonable juegments about the market risk premium and the risk-free . rate 2. What is the required return on each firm based on the CAPM? You can get the beta of cach firm from its Statistics page b. Try using a two-stage growth model, making ressconblc assumptious about bow future a , grow rates will deler lion current growth rates. Compare the intrinsic value drived from the two-stage model to the intruse values you find assuzuing a constant-growth rate. Which estimate seems more to inable for each fimm 3. Now choose one of your firms and look up other firms in the same inchustry Performa "Valuation hy Comparbles" analysis hy looking at the priceleamings, price hook value, price'sales, and price operating cash flow ratios of the firms relative to each other and to the industry averace. Which of the firums seem to be overvalued? Which seem to be undervalued? Can you think of reasons to be wary of your conclusions


