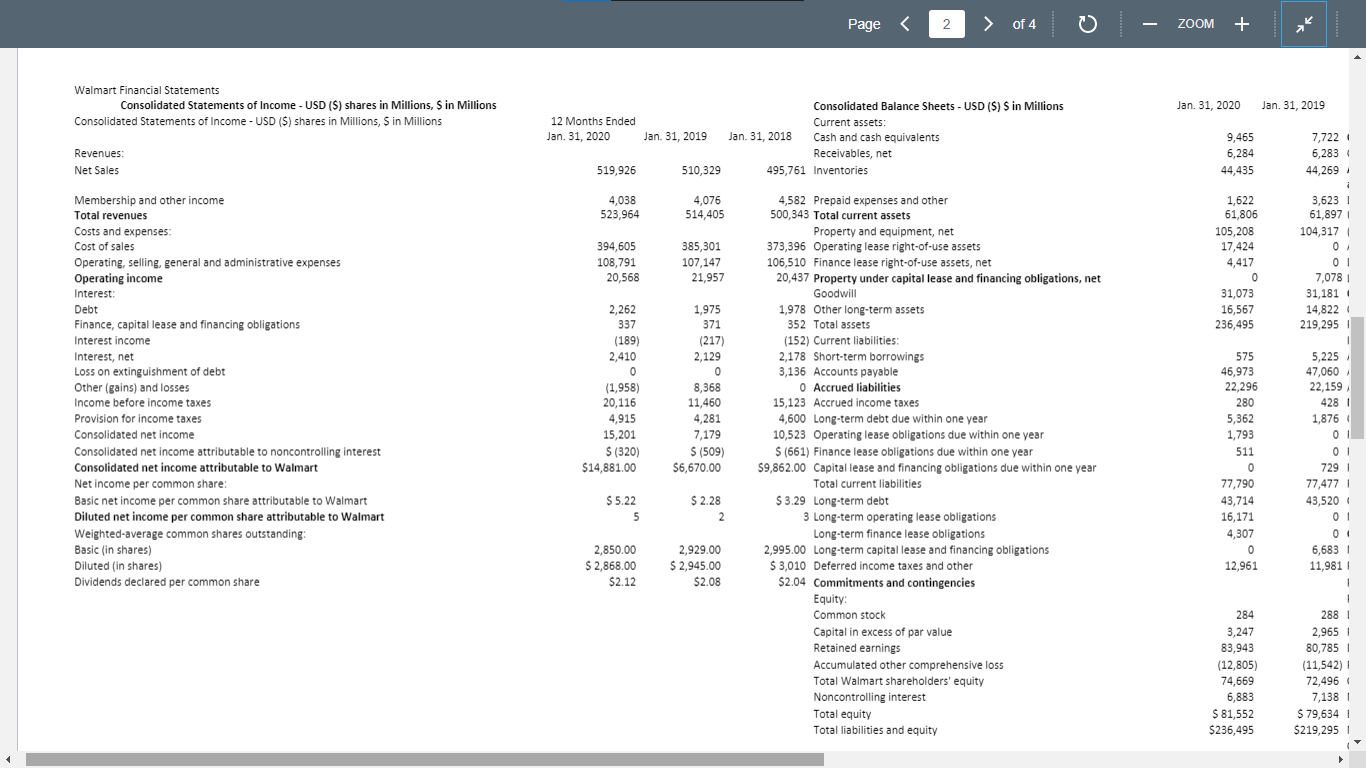
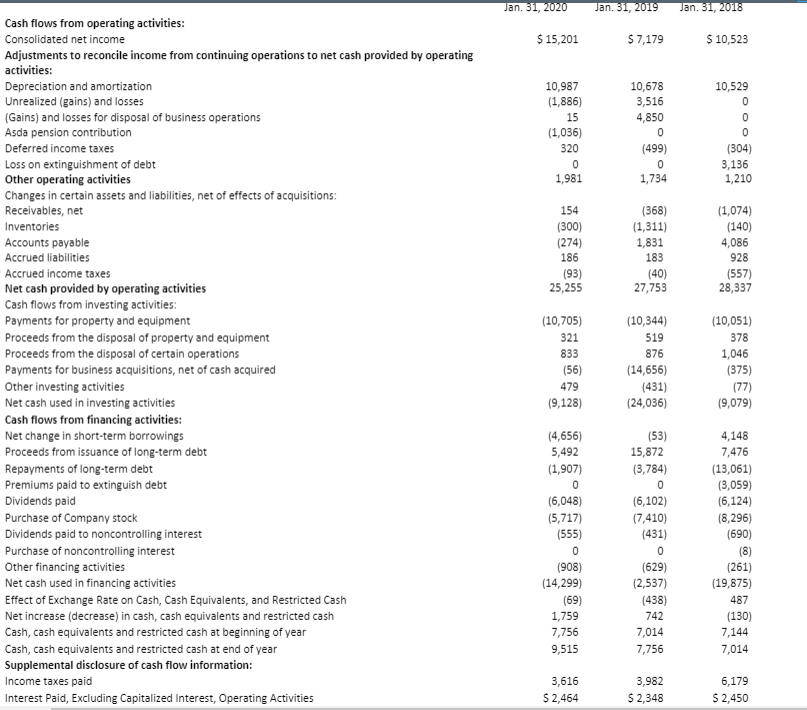
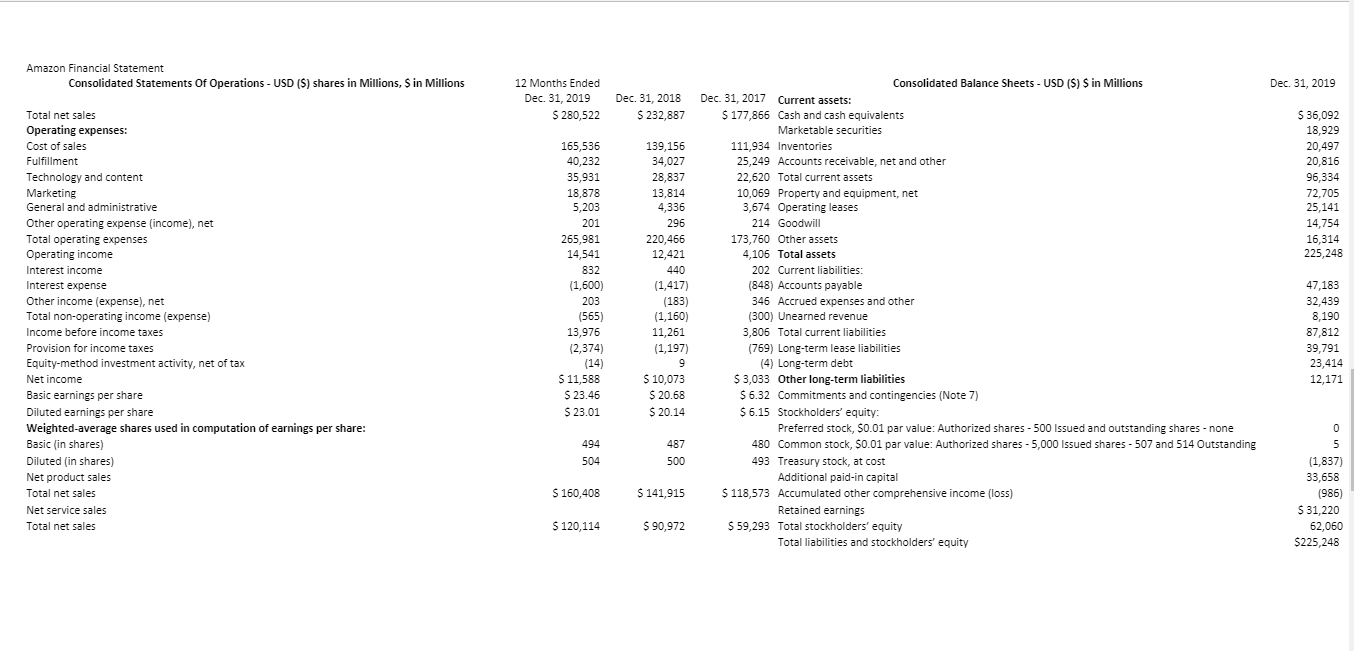
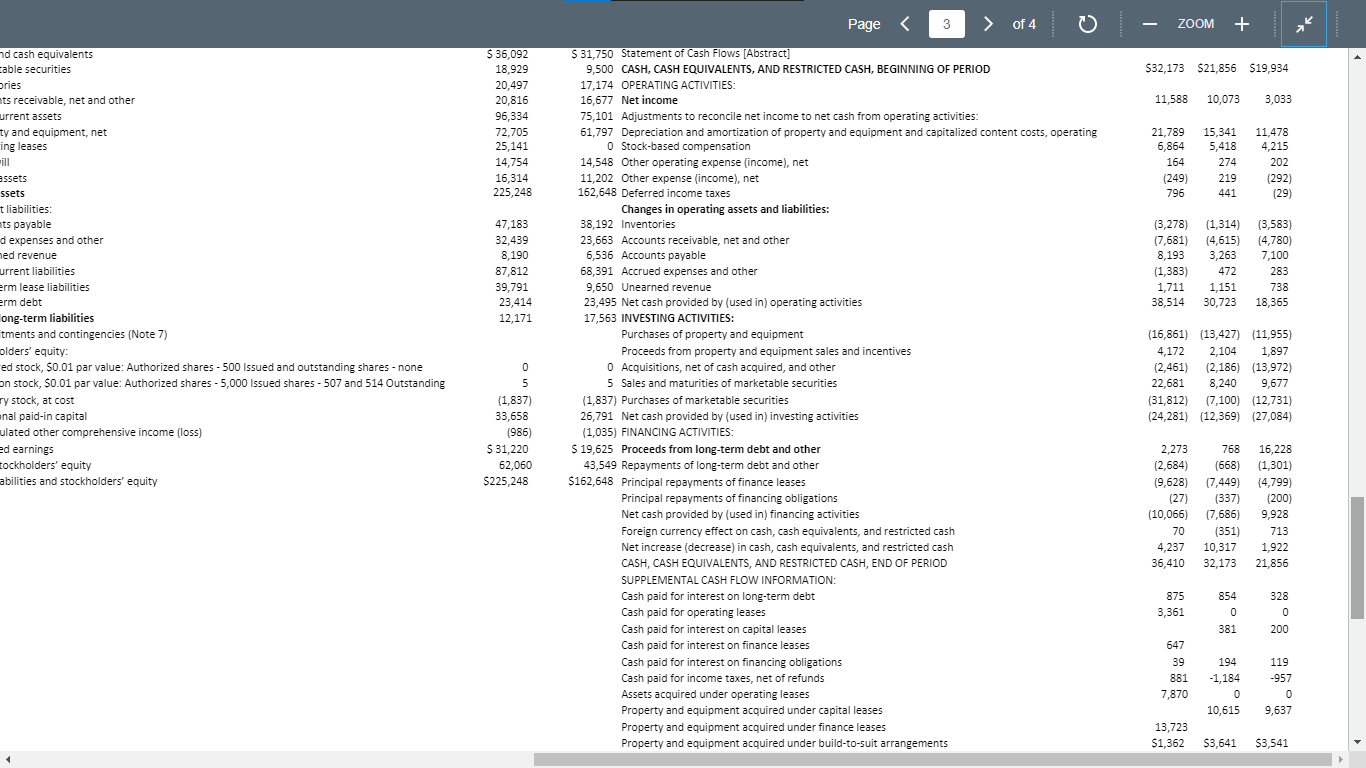
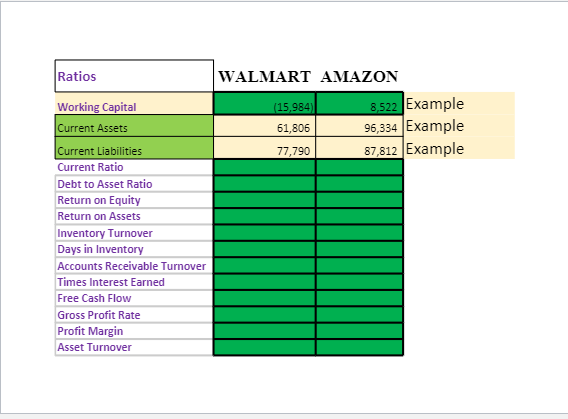
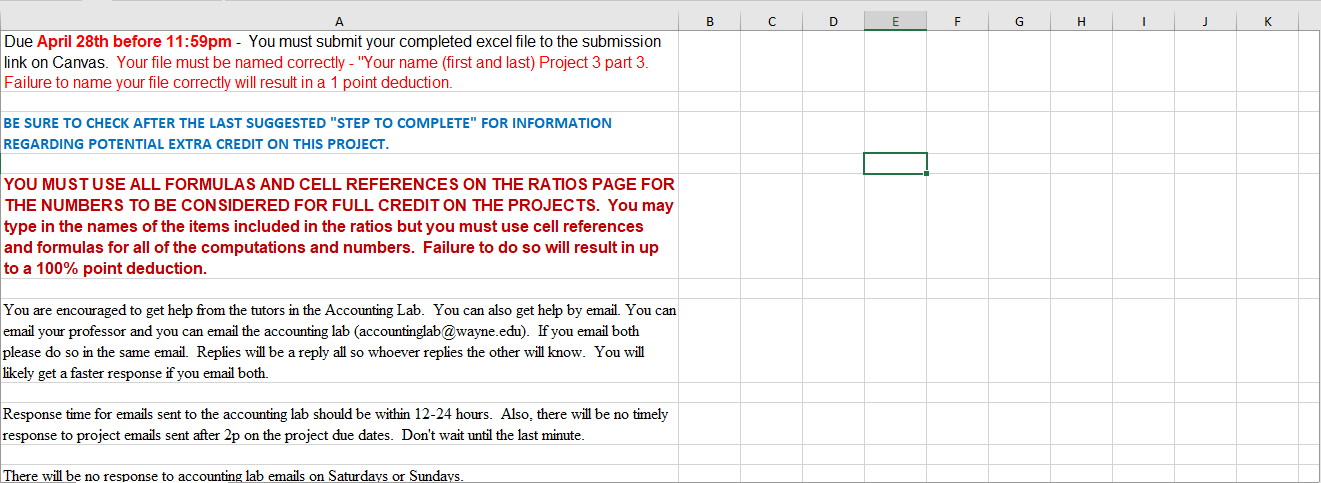
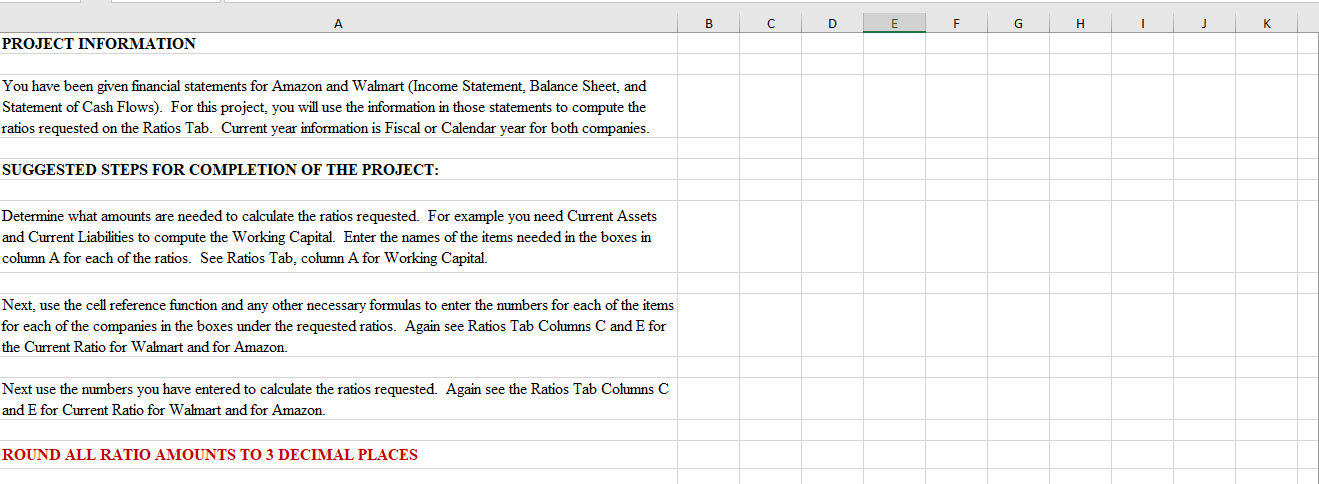
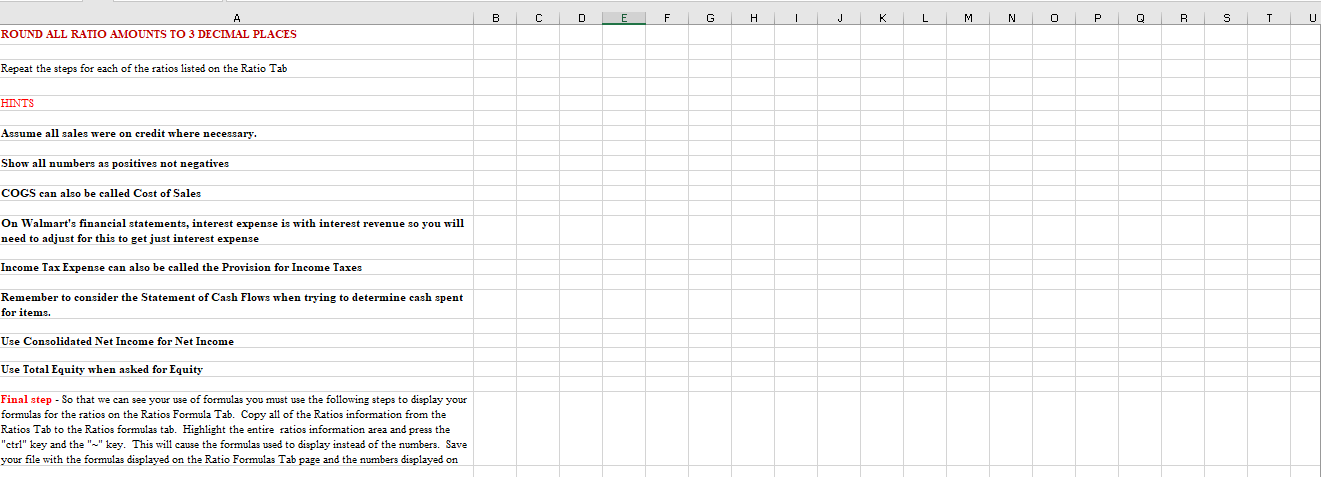
Page of 4 ZOOM + Walmart Financial Statements Consolidated Statements of Income - USD ($) shares in Millions, Sin Millions Consolidated Statements of Income - USD ($) shares in Millions, S in Millions Jan. 31, 2020 Jan. 31, 2019 12 Months Ended Jan. 31, 2020 Jan. 31, 2019 Consolidated Balance Sheets - USD ($) Sin Millions Current assets: Jan. 31, 2018 Cash and cash equivalents Receivables, net 495,761 Inventories 9,465 6,284 44,435 7,722 6,283 Revenues: Net Sales 519,926 510,329 44,269 4,038 523,964 4,076 514,405 394,605 108,791 20,568 385,301 107,147 21,957 1,622 61,806 105,208 17,424 4,417 0 31,073 16,567 236,495 Membership and other income Total revenues Costs and expenses Cost of sales Operating, selling, general and administrative expenses Operating income Interest: Debt Finance, capital lease and financing obligations Interest income Interest, net Loss on extinguishment of debt Other (gains) and losses Income before income taxes Provision for income taxes Consolidated net income Consolidated net income attributable to noncontrolling interest Consolidated net income attributable to Walmart Net income per common share: Basic net income per common share attributable to Walmart Diluted net income per common share attributable to Walmart Weighted-average common shares outstanding: Basic (in shares) Diluted in shares) Dividends declared per common share 2,262 337 (189) 2,410 0 DES (1,958) 1,975 371 (217) 2,129 0 8,368 11,460 4,281 7,179 $ (509) $6,670.00 575 46,973 22,296 280 252 5,362 1,793 798 20.116 3,6231 61,8971 104,317 0 01 7,078 31,181 14,822 219,2951 1 5,225 47,060 22,159 4281 1,876 01 01 7291 77,477 43,520 01 01 6,6831 11,981 4,915 15,201 $ (320) $14,881.00 4,582 Prepaid expenses and other 500,343 Total current assets Property and equipment, net 373,396 Operating lease right-of-use assets 106,510 Finance lease right-of-use assets, net 20,437 Property under capital lease and financing obligations, net Goodwill 1,978 Other long-term assets 352 Total assets (152) Current liabilities: 2,178 Short-term borrowings * 3,136 Accounts payable Accrued liabilities 15,123 Accrued income taxes 4,600 Long-term debt due within one year 10,523 Operating lease obligations due within one year $ (661) Finance lease obligations due within one year $9,862.00 Capital lease and financing obligations due within one year Total current liabilities $ 3.29 Long-term debt 3 Long-term operating lease obligations Long-term finance lease obligations 2,995.00 Long-term capital lease and financing obligations $ 3,010 Deferred income taxes and other $2.04 Commitments and contingencies Equity: Common stock Capital in excess of par value Retained earnings Accumulated other comprehensive loss Total Walmart shareholders' equity Noncontrolling interest Total equity Total liabilities and equity 511 5522 $5.22 5 $ 2.28 2 0 77,790 43,714 16,171 4,307 0 12,961 2,850.00 $ 2,868.00 $2.12 2,929.00 $ 2,945.00 $2.08 284 3,247 83,943 (12,805) 74,669 6,883 $ 81,552 $236,495 1 2881 2,965 80,785 (11,542) 72,496 7,138 $ 79,6341 $219,295 Jan. 31, 2020 Jan. 31, 2019 Jan. 31, 2018 $ 15,201 $ 7,179 $ 10,523 10,987 (1,886) 15 (1,036) 10,678 3,516 4,850 0 (499) 0 1,734 10,529 0 0 0 (304) 3,136 1,210 320 0 1,981 154 (300) (274) (368) (1,311) 1,831 183 (40) 27,753 (1,074) (140) 4,086 928 (557) 28,337 186 (93) 25,255 (10,705) Cash flows from operating activities: Consolidated net income Adjustments to reconcile income from continuing operations to net cash provided by operating activities: Depreciation and amortization Unrealized (gains) and losses (Gains) and losses for disposal of business operations Asda pension contribution Deferred income taxes Loss on extinguishment of debt Other operating activities Changes in certain assets and liabilities, net of effects of acquisitions: Receivables, net Inventories Accounts payable Accrued liabilities Accrued income taxes Net cash provided by operating activities Cash flows from investing activities: Payments for property and equipment Proceeds from the disposal of property and equipment Proceeds from the disposal of certain operations Payments for business acquisitions, net of cash acquired Other investing activities Net cash used in investing activities Cash flows from financing activities: Net change in short-term borrowings Proceeds from issuance of long-term debt Repayments of long-term debt Premiums paid to extinguish debt Dividends paid Purchase of Company stock Dividends paid to noncontrolling interest Purchase of noncontrolling interest Other financing activities Net cash used in financing activities Effect of Exchange Rate on Cash, Cash Equivalents, and Restricted Cash Net increase (decrease) in cash, cash equivalents and restricted cash Cash, cash equivalents and restricted cash at beginning of year Cash, cash equivalents and restricted cash at end of year Supplemental disclosure of cash flow information: Income taxes paid Interest Paid, Excluding Capitalized Interest, Operating Activities 321 833 (56) 479 (9,128) (10,344) 519 876 (14,656) (431) (24,036) (10,051) 378 1,046 (375) (77) (9,079) (4,656) 5,492 (1,907) 0 (6,048) (5,717) (555) 0 (908) (14,299) (69) 1,759 7,756 9,515 (53) 15,872 (3,784) 0 (6,102) 17,410) (431) 0 (629) (2,537) (438) 742 7,014 7,756 4,148 7,476 (13,061) (3,059) (6,124) (8,296) (690) (8) (261) (19,875) 487 (130) 7,144 7,014 3,616 $ 2,464 3,982 $ 2,348 6,179 $ 2,450 Amazon Financial Statement Consolidated Statements Of Operations - USD ($) shares in Millions, S in Millions Dec 31, 2019 12 Months Ended Dec. 31, 2019 $ 280,522 Dec 31, 2018 $ 232,887 $ 36,092 18,929 20,497 20,816 96,334 72,705 25,141 14.754 16,314 225,248 Total net sales Operating expenses: Cost of sales Fulfillment Technology and content Marketing General and administrative Other operating expense (income), net Total operating expenses Operating income Interest income ces com Interest expense Other income (expense), net Total non-operating income (expense) Income before income taxes Provision for income taxes Equity-method investment activity, net of tax M Net income Basic earnings per share Diluted earnings per share Weighted average shares used in computation of earnings per share: Basic (in shares) ) Diluted in shares) ) Net product sales Total net sales Net service sales Total net sales 165,536 40,232 35,931 18,878 5,203 201 265,981 14,541 832 004 (1,600) 203 ter (565) 13,976 (2,374) (14) $ 11,588 S 23.46 $ 23.01 139,156 34,027 28.837 13,814 4,336 296 220,466 12,421 440 110 (1,417) (183) (1,160) 11,261 (1,197) 9 $ 10,073 $ 20.68 $ 20.14 Consolidated Balance Sheets - USD ($) S in Millions Dec 31, 2017 Current assets: $ 177,866 Cash and cash equivalents Marketable securities 111,934 Inventories 25,249 Accounts receivable, net and other 22,620 Total current assets 10,069 Property and equipment, net 3,674 Operating leases 214 Goodwill 173,760 Other assets 4,106 Total assets 202 Current liabilities: (848) Accounts payable 346 Accrued expenses and other 12001 (300) Unearned revenue 3,806 Total current liabilities (769) Long-term lease liabilities (4) Long-term debt $ 3,033 Other long-term liabilities nas other one term $6.32 Commitments and contingencies (Note 7) $6.15 Stockholders' equity: Preferred stock, $0.01 par value: Authorized shares - 500 Issued and outstanding shares - none 480 Common stock, $0.01 par value: Authorized shares - 5,000 Issued shares - 507 and 514 Outstanding 493 Treasury stock, at cost Additional paid-in capital $ 118,573 Accumulated other comprehensive income (loss) Retained earnings $ 59,293 Total stockholders' equity Total liabilities and stockholders' equity 47,183 32,439 8,190 87,812 39,791 23,414 12,171 494 504 487 500 0 5 (1,837) 33,658 (986) $ 160,408 $ 141,915 $ 31,220 S 120,114 $ 90,972 62,060 $225,248 Page of 4 ZOOM + $32,173 $21,856 $19,934 nd cash equivalents table securities ories Its receivable, net and other , urrent assets ty and equipment, net ing leases 11,588 10,078 3,033 S 36,092 18,929 20.497 20.816 96.334 72.705 25,141 14,754 16,314 225,248 21.789 6,864 164 (249) 796 15,341 5,418 274 219 441 11.478 4.215 202 (292) (29) assets ssets t liabilities: nts payable d expenses and other ned revenue 47,183 32,439 8,190 87,812 39,791 23,414 12,171 (3,278) (1,314) (7,681) (4,615) 8,193 3,263 (1,383) 472 1,711 1.151 38,514 30,723 (3,583) (4,780) 7,100 283 738 18,365 urrent liabilities erm lease liabilities erm debt long-term liabilities tments and contingencies (Note 7) ans Diders ed stock, $0.01 par value: Authorized shares - 500 Issued and outstanding shares - none on stock, 50.01 par value: Authorized shares - 5,000 Issued shares - 507 and 514 Outstanding Ty stock, at cost nal paid-in capital ulated other comprehensive income (loss) olders' equity 0 5 (1,837) 33,658 1986) $ 31,220 62,060 $225,248 S 31,750 Statement of Cash Flows [Abstract] 9,500 CASH, CASH EQUIVALENTS, AND RESTRICTED CASH, BEGINNING OF PERIOD 17,174 OPERATING ACTIVITIES: 16,677 Net income 75,101 Adjustments to reconcile net income to net cash from operating activities: 61,797 Depreciation and amortization of property and equipment and capitalized content costs, operating 0 Stock-based compensation 14,548 Other operating expense (income), net 11,202 Other expense (income), net 162,648 Deferred income taxes Changes in operating assets and liabilities: 38,192 Inventories 23,663 Accounts receivable, net and other 6,536 Accounts payable 68,391 Accrued expenses and other 9,650 Unearned revenue 23,495 Net cash provided by (used in) operating activities 17,563 INVESTING ACTIVITIES: Purchases of property and equipment Proceeds from property and equipment sales and incentives 0 Acquisitions, net of cash acquired, and other 5 Sales and maturities of marketable securities (1,837) Purchases of marketable securities 26,791 Net cash provided by (used in) investing activities (1,035) FINANCING ACTIVITIES: $ 19,625 Proceeds from long-term debt and other 43,549 Repayments of long-term debt and other $162,648 Principal repayments of finance leases Principal repayments of financing obligations Net cash provided by (used in) financing activities Foreign currency effect on cash, cash equivalents, and restricted cash Net increase (decrease) in cash, cash equivalents, and restricted cash CASH, CASH EQUIVALENTS, AND RESTRICTED CASH, END OF PERIOD SUPPLEMENTAL CASH FLOW INFORMATION: Cash paid for interest on long-term debt Cash paid for operating leases Cash paid for interest on capital leases Cash paid for interest on finance leases Cash paid for interest on financing obligations son Cash paid for income taxes, net of refunds Assets acquired under operating leases Property and equipment acquired under capital leases Property and equipment acquired under finance leases Property and equipment acquired under build-to-suit arrangements (16,861) (13,427) (11,955) 4,172 2,104 1,897 (2,461 (2,186) (13,972) 22,681 8,240 9,677 (31,812) (7,100) (12,731) (24,281) (12,369) (27,084) ed earnings tockholders' equity abilities and stockholders' equity 2,273 768 (2,684) (668) (9,628) (7,449) (27) (337) (10,066) (7,686) 70 (351) 4,237 10,317 36,410 32,173 16,228 (1,301) (4,799) (200) 9,928 713 1,922 21,856 875 3,361 854 0 381 328 0 200 647 39 881 7,870 194 -1,184 0 10,615 119 -957 0 9,637 13,723 $1,362 $3,641 $3,541 Ratios (15,984) WALMART AMAZON 8,522 Example 61,806 96,334 Example 77,790 87,812 Example Working Capital Current Assets Current Liabilities Current Ratio Debt to Asset Ratio Return on Equity Return on Assets Inventory Turnover Days in Inventory Accounts Receivable Turnover Times Interest Earned Free Cash Flow Gross Profit Rate Profit Margin Asset Turnover A B D E F G H J K Due April 28th before 11:59pm - You must submit your completed excel file to the submission link on Canvas. Your file must be named correctly - "Your name (first and last) Project 3 part 3. Failure to name your file correctly will result in a 1 point deduction. BE SURE TO CHECK AFTER THE LAST SUGGESTED "STEP TO COMPLETE" FOR INFORMATION REGARDING POTENTIAL EXTRA CREDIT ON THIS PROJECT. YOU MUSTUSE ALL FORMULAS AND CELL REFERENCES ON THE RATIOS PAGE FOR THE NUMBERS TO BE CONSIDERED FOR FULL CREDIT ON THE PROJECTS. You may type in the names of the items included in the ratios but you must use cell references and formulas for all of the computations and numbers. Failure to do so will result in up to a 100% point deduction. You are encouraged to get help from the tutors in the Accounting Lab. You can also get help by email. You can email your professor and you can email the accounting lab (accountinglab@wayne.edu). If you email both please do so in the same email. Replies will be a reply all so whoever replies the other will know. You will likely get a faster response if you email both. Response time for emails sent to the accounting lab should be within 12-24 hours. Also, there will be no timely response to project emails sent after 2p on the project due dates. Don't wait until the last minute. There will be no response to accounting lab emails on Saturdays or Sundays. A B D E F H J K PROJECT INFORMATION You have been given financial statements for Amazon and Walmart (Income Statement. Balance Sheet, and Statement of Cash Flows). For this project, you will use the information in those statements to compute the ratios requested on the Ratios Tab. Current year information is Fiscal or Calendar year for both companies. SUGGESTED STEPS FOR COMPLETION OF THE PROJECT: Determine what amounts are needed to calculate the ratios requested. For example you need Current Assets and Current Liabilities to compute the Working Capital. Enter the names of the items needed in the boxes in column A for each of the ratios. See Ratios Tab, column A for Working Capital. Next, use the cell reference function and any other necessary formulas to enter the numbers for each of the items for each of the companies in the boxes under the requested ratios. Again see Ratios Tab Columns C and E for the Current Ratio for Walmart and for Amazon. Next use the numbers you have entered to calculate the ratios requested. Again see the Ratios Tab Columns C and E for Current Ratio for Walmart and for Amazon. ROUND ALL RATIO AMOUNTS TO 3 DECIMAL PLACES B c E F G H J K L M N 0 Q R S ROUND ALL RATIO AMOUNTS TO 3 DECIMAL PLACES Repeat the steps for each of the ratios listed on the Ratio Tab HINTS Assume all sales were on credit where necessary. Show all numbers as positives not negatives COGS can also be called Cost of Sales On Walmart's financial statements, interest expense is with interest revenue so you will need to adjust for this to get just interest expense Income Tax Expense can also be called the Provision for Income Taxes determine cash spent Remember to consider the Statement of Cash Flows when trying for items. Use Consolidated Net Income for Net Income Use Total Equity when asked for Equity Final step-So that we can see your use of formulas you must use the following steps to display your formulas for the ratios on the Ratios Formula Tab. Copy all of the Ratios information from the Ratios Tab to the Ratios formulas tab. Highlight the entire ratios information area and press the "ctrl" key and the "V" key. This will cause the formulas used to display instead of the numbers. Save your file with the formulas displayed on the Ratio Formulas Tab page and the numbers displayed on Page of 4 ZOOM + Walmart Financial Statements Consolidated Statements of Income - USD ($) shares in Millions, Sin Millions Consolidated Statements of Income - USD ($) shares in Millions, S in Millions Jan. 31, 2020 Jan. 31, 2019 12 Months Ended Jan. 31, 2020 Jan. 31, 2019 Consolidated Balance Sheets - USD ($) Sin Millions Current assets: Jan. 31, 2018 Cash and cash equivalents Receivables, net 495,761 Inventories 9,465 6,284 44,435 7,722 6,283 Revenues: Net Sales 519,926 510,329 44,269 4,038 523,964 4,076 514,405 394,605 108,791 20,568 385,301 107,147 21,957 1,622 61,806 105,208 17,424 4,417 0 31,073 16,567 236,495 Membership and other income Total revenues Costs and expenses Cost of sales Operating, selling, general and administrative expenses Operating income Interest: Debt Finance, capital lease and financing obligations Interest income Interest, net Loss on extinguishment of debt Other (gains) and losses Income before income taxes Provision for income taxes Consolidated net income Consolidated net income attributable to noncontrolling interest Consolidated net income attributable to Walmart Net income per common share: Basic net income per common share attributable to Walmart Diluted net income per common share attributable to Walmart Weighted-average common shares outstanding: Basic (in shares) Diluted in shares) Dividends declared per common share 2,262 337 (189) 2,410 0 DES (1,958) 1,975 371 (217) 2,129 0 8,368 11,460 4,281 7,179 $ (509) $6,670.00 575 46,973 22,296 280 252 5,362 1,793 798 20.116 3,6231 61,8971 104,317 0 01 7,078 31,181 14,822 219,2951 1 5,225 47,060 22,159 4281 1,876 01 01 7291 77,477 43,520 01 01 6,6831 11,981 4,915 15,201 $ (320) $14,881.00 4,582 Prepaid expenses and other 500,343 Total current assets Property and equipment, net 373,396 Operating lease right-of-use assets 106,510 Finance lease right-of-use assets, net 20,437 Property under capital lease and financing obligations, net Goodwill 1,978 Other long-term assets 352 Total assets (152) Current liabilities: 2,178 Short-term borrowings * 3,136 Accounts payable Accrued liabilities 15,123 Accrued income taxes 4,600 Long-term debt due within one year 10,523 Operating lease obligations due within one year $ (661) Finance lease obligations due within one year $9,862.00 Capital lease and financing obligations due within one year Total current liabilities $ 3.29 Long-term debt 3 Long-term operating lease obligations Long-term finance lease obligations 2,995.00 Long-term capital lease and financing obligations $ 3,010 Deferred income taxes and other $2.04 Commitments and contingencies Equity: Common stock Capital in excess of par value Retained earnings Accumulated other comprehensive loss Total Walmart shareholders' equity Noncontrolling interest Total equity Total liabilities and equity 511 5522 $5.22 5 $ 2.28 2 0 77,790 43,714 16,171 4,307 0 12,961 2,850.00 $ 2,868.00 $2.12 2,929.00 $ 2,945.00 $2.08 284 3,247 83,943 (12,805) 74,669 6,883 $ 81,552 $236,495 1 2881 2,965 80,785 (11,542) 72,496 7,138 $ 79,6341 $219,295 Jan. 31, 2020 Jan. 31, 2019 Jan. 31, 2018 $ 15,201 $ 7,179 $ 10,523 10,987 (1,886) 15 (1,036) 10,678 3,516 4,850 0 (499) 0 1,734 10,529 0 0 0 (304) 3,136 1,210 320 0 1,981 154 (300) (274) (368) (1,311) 1,831 183 (40) 27,753 (1,074) (140) 4,086 928 (557) 28,337 186 (93) 25,255 (10,705) Cash flows from operating activities: Consolidated net income Adjustments to reconcile income from continuing operations to net cash provided by operating activities: Depreciation and amortization Unrealized (gains) and losses (Gains) and losses for disposal of business operations Asda pension contribution Deferred income taxes Loss on extinguishment of debt Other operating activities Changes in certain assets and liabilities, net of effects of acquisitions: Receivables, net Inventories Accounts payable Accrued liabilities Accrued income taxes Net cash provided by operating activities Cash flows from investing activities: Payments for property and equipment Proceeds from the disposal of property and equipment Proceeds from the disposal of certain operations Payments for business acquisitions, net of cash acquired Other investing activities Net cash used in investing activities Cash flows from financing activities: Net change in short-term borrowings Proceeds from issuance of long-term debt Repayments of long-term debt Premiums paid to extinguish debt Dividends paid Purchase of Company stock Dividends paid to noncontrolling interest Purchase of noncontrolling interest Other financing activities Net cash used in financing activities Effect of Exchange Rate on Cash, Cash Equivalents, and Restricted Cash Net increase (decrease) in cash, cash equivalents and restricted cash Cash, cash equivalents and restricted cash at beginning of year Cash, cash equivalents and restricted cash at end of year Supplemental disclosure of cash flow information: Income taxes paid Interest Paid, Excluding Capitalized Interest, Operating Activities 321 833 (56) 479 (9,128) (10,344) 519 876 (14,656) (431) (24,036) (10,051) 378 1,046 (375) (77) (9,079) (4,656) 5,492 (1,907) 0 (6,048) (5,717) (555) 0 (908) (14,299) (69) 1,759 7,756 9,515 (53) 15,872 (3,784) 0 (6,102) 17,410) (431) 0 (629) (2,537) (438) 742 7,014 7,756 4,148 7,476 (13,061) (3,059) (6,124) (8,296) (690) (8) (261) (19,875) 487 (130) 7,144 7,014 3,616 $ 2,464 3,982 $ 2,348 6,179 $ 2,450 Amazon Financial Statement Consolidated Statements Of Operations - USD ($) shares in Millions, S in Millions Dec 31, 2019 12 Months Ended Dec. 31, 2019 $ 280,522 Dec 31, 2018 $ 232,887 $ 36,092 18,929 20,497 20,816 96,334 72,705 25,141 14.754 16,314 225,248 Total net sales Operating expenses: Cost of sales Fulfillment Technology and content Marketing General and administrative Other operating expense (income), net Total operating expenses Operating income Interest income ces com Interest expense Other income (expense), net Total non-operating income (expense) Income before income taxes Provision for income taxes Equity-method investment activity, net of tax M Net income Basic earnings per share Diluted earnings per share Weighted average shares used in computation of earnings per share: Basic (in shares) ) Diluted in shares) ) Net product sales Total net sales Net service sales Total net sales 165,536 40,232 35,931 18,878 5,203 201 265,981 14,541 832 004 (1,600) 203 ter (565) 13,976 (2,374) (14) $ 11,588 S 23.46 $ 23.01 139,156 34,027 28.837 13,814 4,336 296 220,466 12,421 440 110 (1,417) (183) (1,160) 11,261 (1,197) 9 $ 10,073 $ 20.68 $ 20.14 Consolidated Balance Sheets - USD ($) S in Millions Dec 31, 2017 Current assets: $ 177,866 Cash and cash equivalents Marketable securities 111,934 Inventories 25,249 Accounts receivable, net and other 22,620 Total current assets 10,069 Property and equipment, net 3,674 Operating leases 214 Goodwill 173,760 Other assets 4,106 Total assets 202 Current liabilities: (848) Accounts payable 346 Accrued expenses and other 12001 (300) Unearned revenue 3,806 Total current liabilities (769) Long-term lease liabilities (4) Long-term debt $ 3,033 Other long-term liabilities nas other one term $6.32 Commitments and contingencies (Note 7) $6.15 Stockholders' equity: Preferred stock, $0.01 par value: Authorized shares - 500 Issued and outstanding shares - none 480 Common stock, $0.01 par value: Authorized shares - 5,000 Issued shares - 507 and 514 Outstanding 493 Treasury stock, at cost Additional paid-in capital $ 118,573 Accumulated other comprehensive income (loss) Retained earnings $ 59,293 Total stockholders' equity Total liabilities and stockholders' equity 47,183 32,439 8,190 87,812 39,791 23,414 12,171 494 504 487 500 0 5 (1,837) 33,658 (986) $ 160,408 $ 141,915 $ 31,220 S 120,114 $ 90,972 62,060 $225,248 Page of 4 ZOOM + $32,173 $21,856 $19,934 nd cash equivalents table securities ories Its receivable, net and other , urrent assets ty and equipment, net ing leases 11,588 10,078 3,033 S 36,092 18,929 20.497 20.816 96.334 72.705 25,141 14,754 16,314 225,248 21.789 6,864 164 (249) 796 15,341 5,418 274 219 441 11.478 4.215 202 (292) (29) assets ssets t liabilities: nts payable d expenses and other ned revenue 47,183 32,439 8,190 87,812 39,791 23,414 12,171 (3,278) (1,314) (7,681) (4,615) 8,193 3,263 (1,383) 472 1,711 1.151 38,514 30,723 (3,583) (4,780) 7,100 283 738 18,365 urrent liabilities erm lease liabilities erm debt long-term liabilities tments and contingencies (Note 7) ans Diders ed stock, $0.01 par value: Authorized shares - 500 Issued and outstanding shares - none on stock, 50.01 par value: Authorized shares - 5,000 Issued shares - 507 and 514 Outstanding Ty stock, at cost nal paid-in capital ulated other comprehensive income (loss) olders' equity 0 5 (1,837) 33,658 1986) $ 31,220 62,060 $225,248 S 31,750 Statement of Cash Flows [Abstract] 9,500 CASH, CASH EQUIVALENTS, AND RESTRICTED CASH, BEGINNING OF PERIOD 17,174 OPERATING ACTIVITIES: 16,677 Net income 75,101 Adjustments to reconcile net income to net cash from operating activities: 61,797 Depreciation and amortization of property and equipment and capitalized content costs, operating 0 Stock-based compensation 14,548 Other operating expense (income), net 11,202 Other expense (income), net 162,648 Deferred income taxes Changes in operating assets and liabilities: 38,192 Inventories 23,663 Accounts receivable, net and other 6,536 Accounts payable 68,391 Accrued expenses and other 9,650 Unearned revenue 23,495 Net cash provided by (used in) operating activities 17,563 INVESTING ACTIVITIES: Purchases of property and equipment Proceeds from property and equipment sales and incentives 0 Acquisitions, net of cash acquired, and other 5 Sales and maturities of marketable securities (1,837) Purchases of marketable securities 26,791 Net cash provided by (used in) investing activities (1,035) FINANCING ACTIVITIES: $ 19,625 Proceeds from long-term debt and other 43,549 Repayments of long-term debt and other $162,648 Principal repayments of finance leases Principal repayments of financing obligations Net cash provided by (used in) financing activities Foreign currency effect on cash, cash equivalents, and restricted cash Net increase (decrease) in cash, cash equivalents, and restricted cash CASH, CASH EQUIVALENTS, AND RESTRICTED CASH, END OF PERIOD SUPPLEMENTAL CASH FLOW INFORMATION: Cash paid for interest on long-term debt Cash paid for operating leases Cash paid for interest on capital leases Cash paid for interest on finance leases Cash paid for interest on financing obligations son Cash paid for income taxes, net of refunds Assets acquired under operating leases Property and equipment acquired under capital leases Property and equipment acquired under finance leases Property and equipment acquired under build-to-suit arrangements (16,861) (13,427) (11,955) 4,172 2,104 1,897 (2,461 (2,186) (13,972) 22,681 8,240 9,677 (31,812) (7,100) (12,731) (24,281) (12,369) (27,084) ed earnings tockholders' equity abilities and stockholders' equity 2,273 768 (2,684) (668) (9,628) (7,449) (27) (337) (10,066) (7,686) 70 (351) 4,237 10,317 36,410 32,173 16,228 (1,301) (4,799) (200) 9,928 713 1,922 21,856 875 3,361 854 0 381 328 0 200 647 39 881 7,870 194 -1,184 0 10,615 119 -957 0 9,637 13,723 $1,362 $3,641 $3,541 Ratios (15,984) WALMART AMAZON 8,522 Example 61,806 96,334 Example 77,790 87,812 Example Working Capital Current Assets Current Liabilities Current Ratio Debt to Asset Ratio Return on Equity Return on Assets Inventory Turnover Days in Inventory Accounts Receivable Turnover Times Interest Earned Free Cash Flow Gross Profit Rate Profit Margin Asset Turnover A B D E F G H J K Due April 28th before 11:59pm - You must submit your completed excel file to the submission link on Canvas. Your file must be named correctly - "Your name (first and last) Project 3 part 3. Failure to name your file correctly will result in a 1 point deduction. BE SURE TO CHECK AFTER THE LAST SUGGESTED "STEP TO COMPLETE" FOR INFORMATION REGARDING POTENTIAL EXTRA CREDIT ON THIS PROJECT. YOU MUSTUSE ALL FORMULAS AND CELL REFERENCES ON THE RATIOS PAGE FOR THE NUMBERS TO BE CONSIDERED FOR FULL CREDIT ON THE PROJECTS. You may type in the names of the items included in the ratios but you must use cell references and formulas for all of the computations and numbers. Failure to do so will result in up to a 100% point deduction. You are encouraged to get help from the tutors in the Accounting Lab. You can also get help by email. You can email your professor and you can email the accounting lab (accountinglab@wayne.edu). If you email both please do so in the same email. Replies will be a reply all so whoever replies the other will know. You will likely get a faster response if you email both. Response time for emails sent to the accounting lab should be within 12-24 hours. Also, there will be no timely response to project emails sent after 2p on the project due dates. Don't wait until the last minute. There will be no response to accounting lab emails on Saturdays or Sundays. A B D E F H J K PROJECT INFORMATION You have been given financial statements for Amazon and Walmart (Income Statement. Balance Sheet, and Statement of Cash Flows). For this project, you will use the information in those statements to compute the ratios requested on the Ratios Tab. Current year information is Fiscal or Calendar year for both companies. SUGGESTED STEPS FOR COMPLETION OF THE PROJECT: Determine what amounts are needed to calculate the ratios requested. For example you need Current Assets and Current Liabilities to compute the Working Capital. Enter the names of the items needed in the boxes in column A for each of the ratios. See Ratios Tab, column A for Working Capital. Next, use the cell reference function and any other necessary formulas to enter the numbers for each of the items for each of the companies in the boxes under the requested ratios. Again see Ratios Tab Columns C and E for the Current Ratio for Walmart and for Amazon. Next use the numbers you have entered to calculate the ratios requested. Again see the Ratios Tab Columns C and E for Current Ratio for Walmart and for Amazon. ROUND ALL RATIO AMOUNTS TO 3 DECIMAL PLACES B c E F G H J K L M N 0 Q R S ROUND ALL RATIO AMOUNTS TO 3 DECIMAL PLACES Repeat the steps for each of the ratios listed on the Ratio Tab HINTS Assume all sales were on credit where necessary. Show all numbers as positives not negatives COGS can also be called Cost of Sales On Walmart's financial statements, interest expense is with interest revenue so you will need to adjust for this to get just interest expense Income Tax Expense can also be called the Provision for Income Taxes determine cash spent Remember to consider the Statement of Cash Flows when trying for items. Use Consolidated Net Income for Net Income Use Total Equity when asked for Equity Final step-So that we can see your use of formulas you must use the following steps to display your formulas for the ratios on the Ratios Formula Tab. Copy all of the Ratios information from the Ratios Tab to the Ratios formulas tab. Highlight the entire ratios information area and press the "ctrl" key and the "V" key. This will cause the formulas used to display instead of the numbers. Save your file with the formulas displayed on the Ratio Formulas Tab page and the numbers displayed on