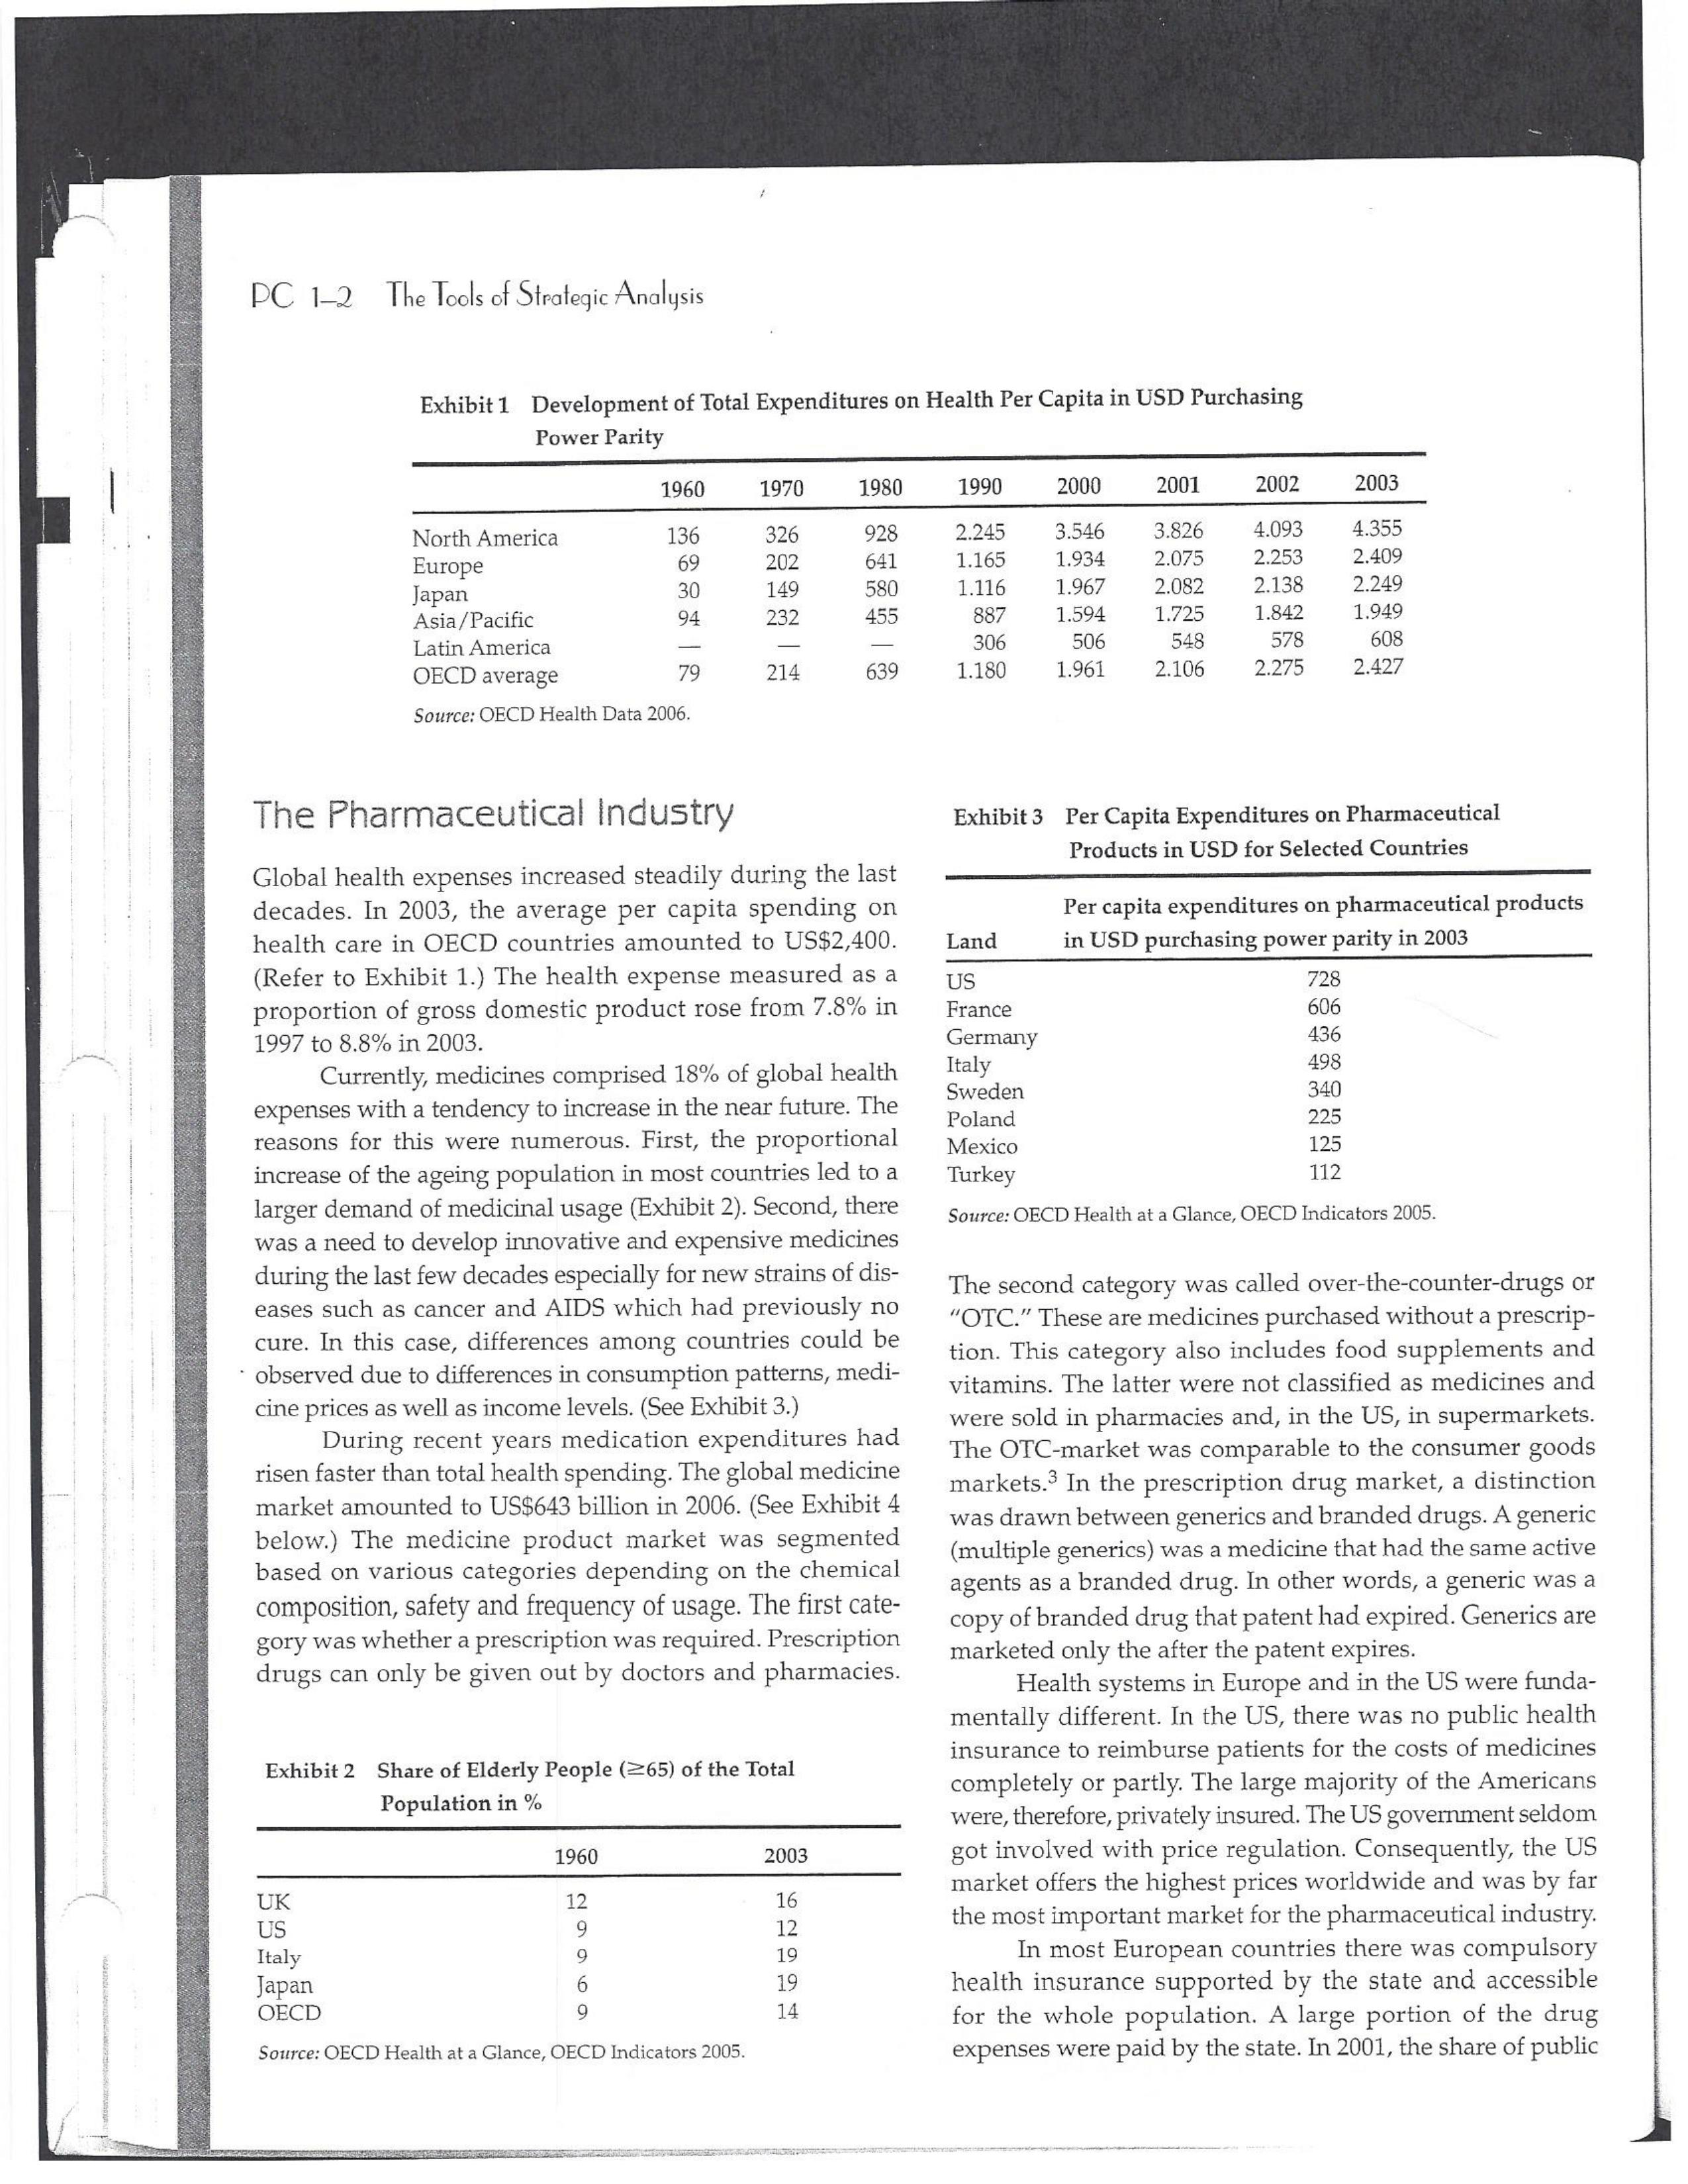
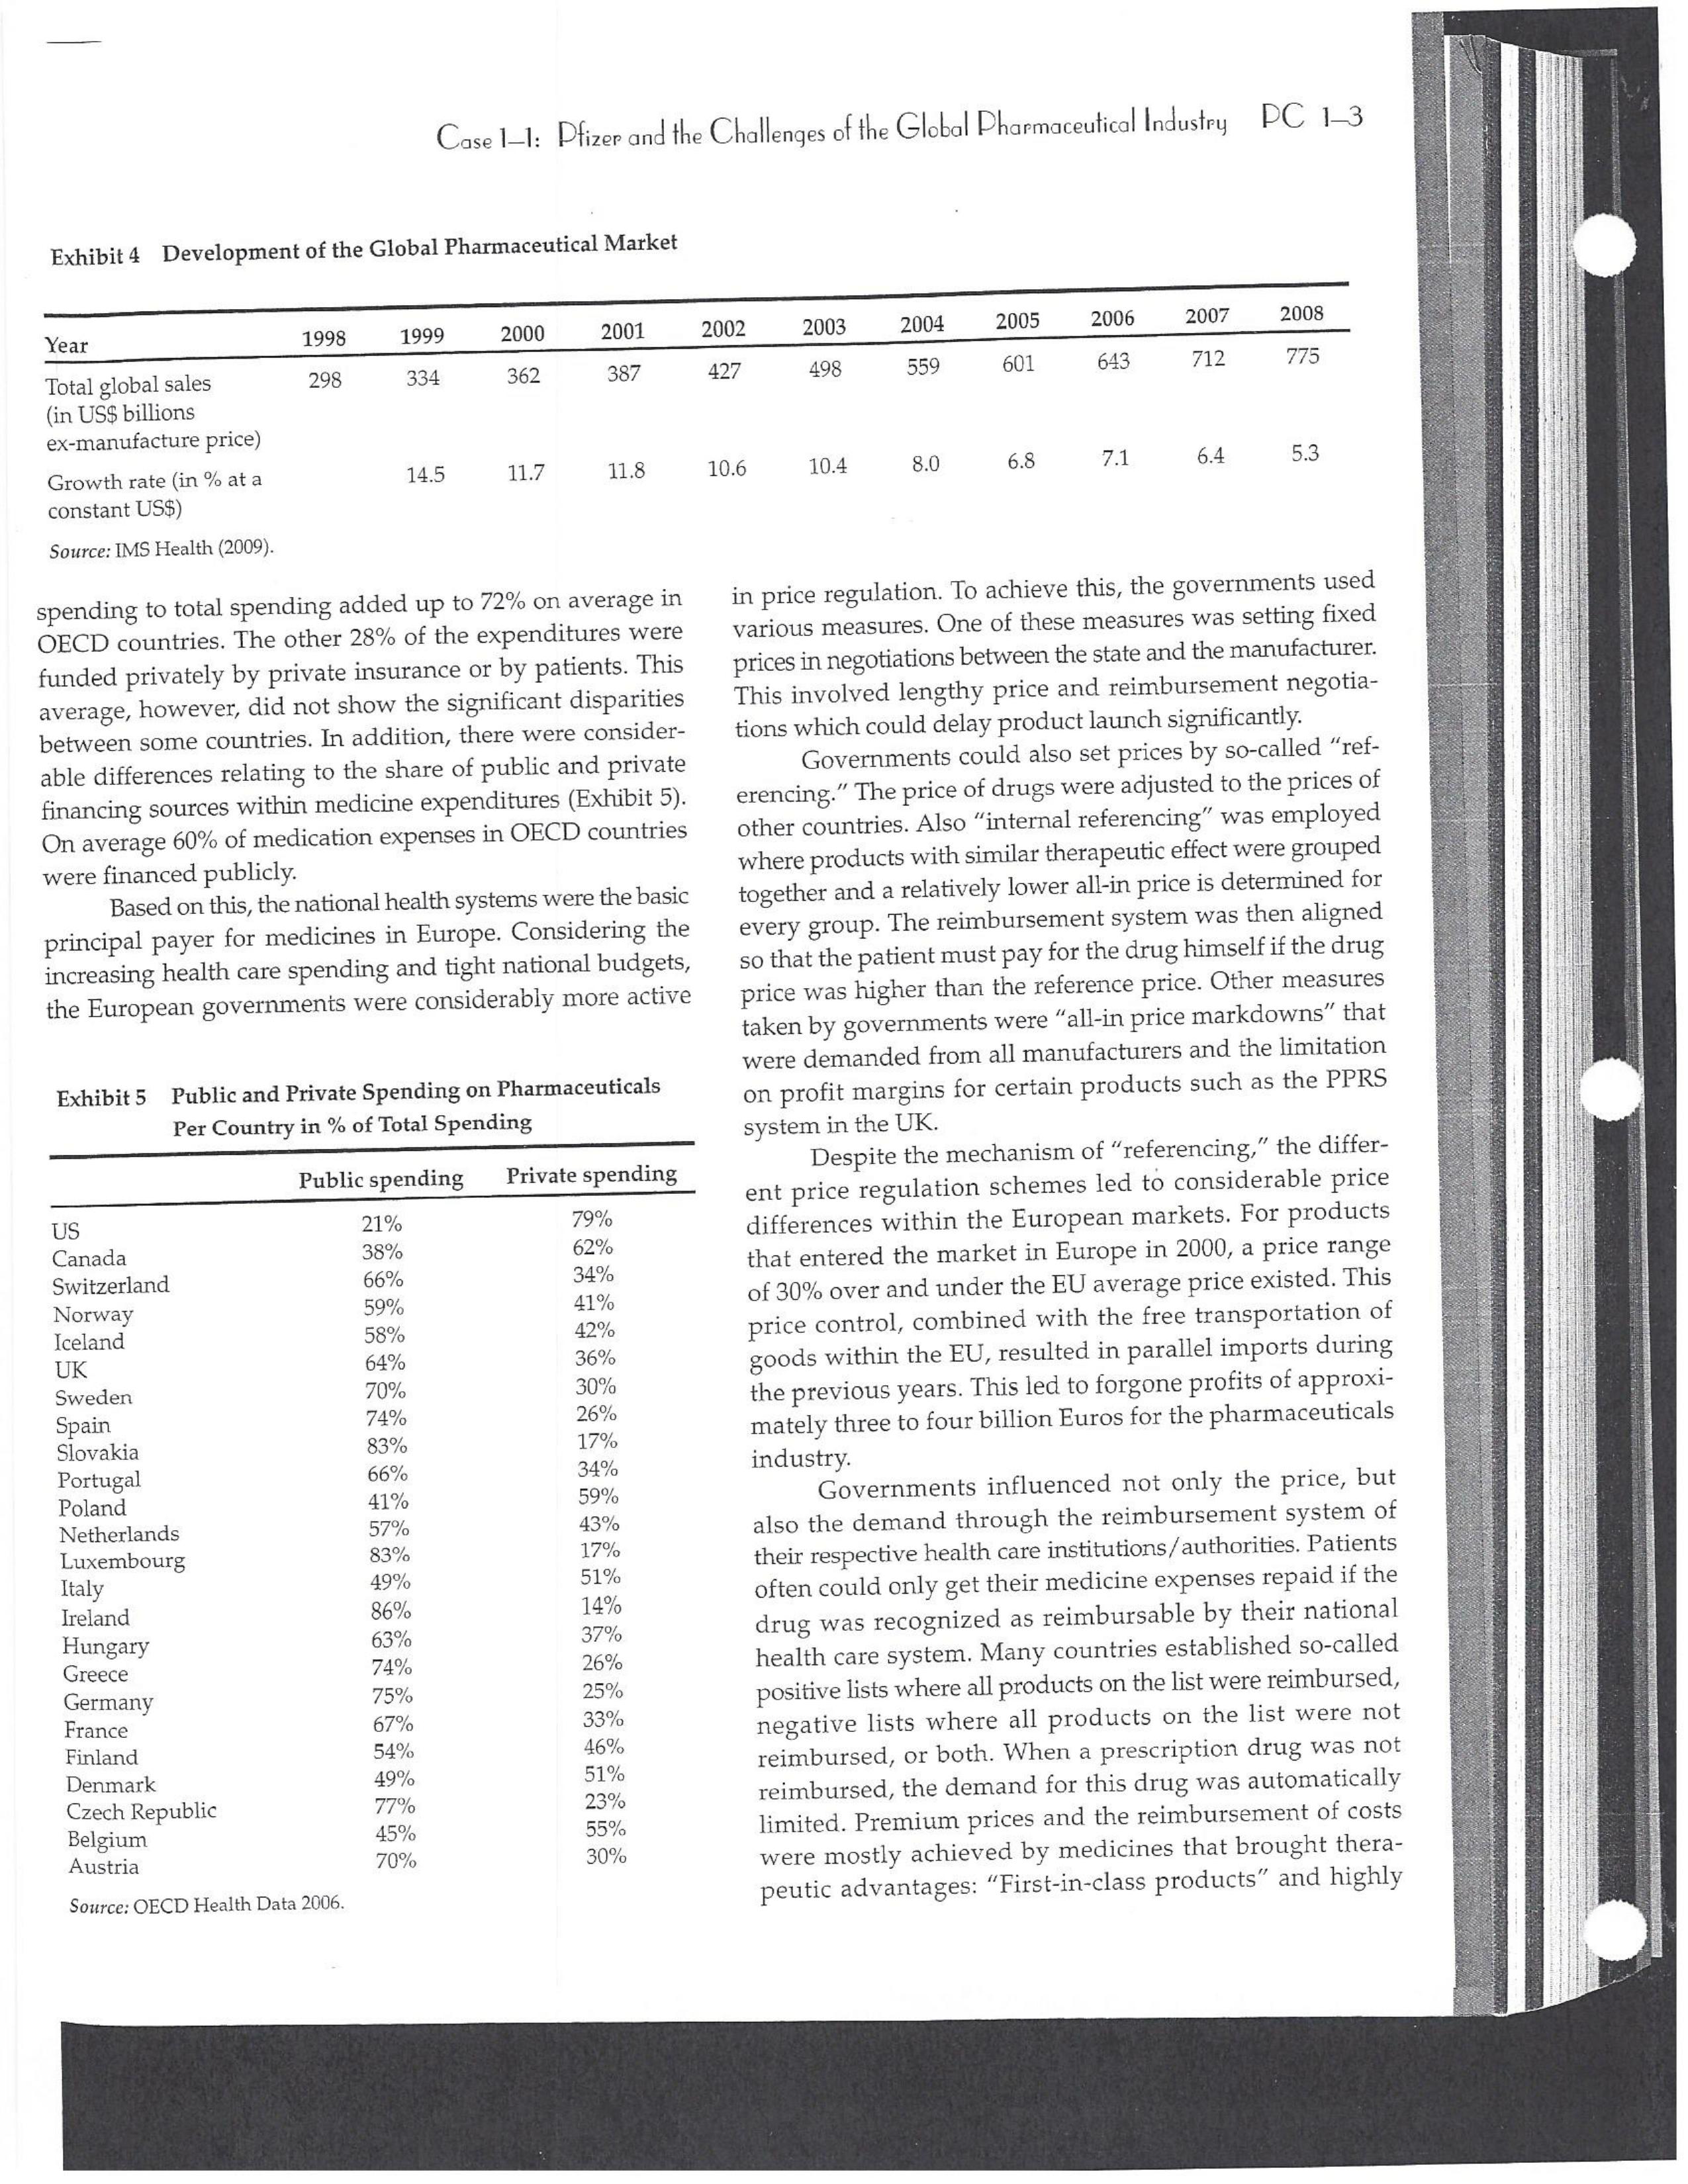
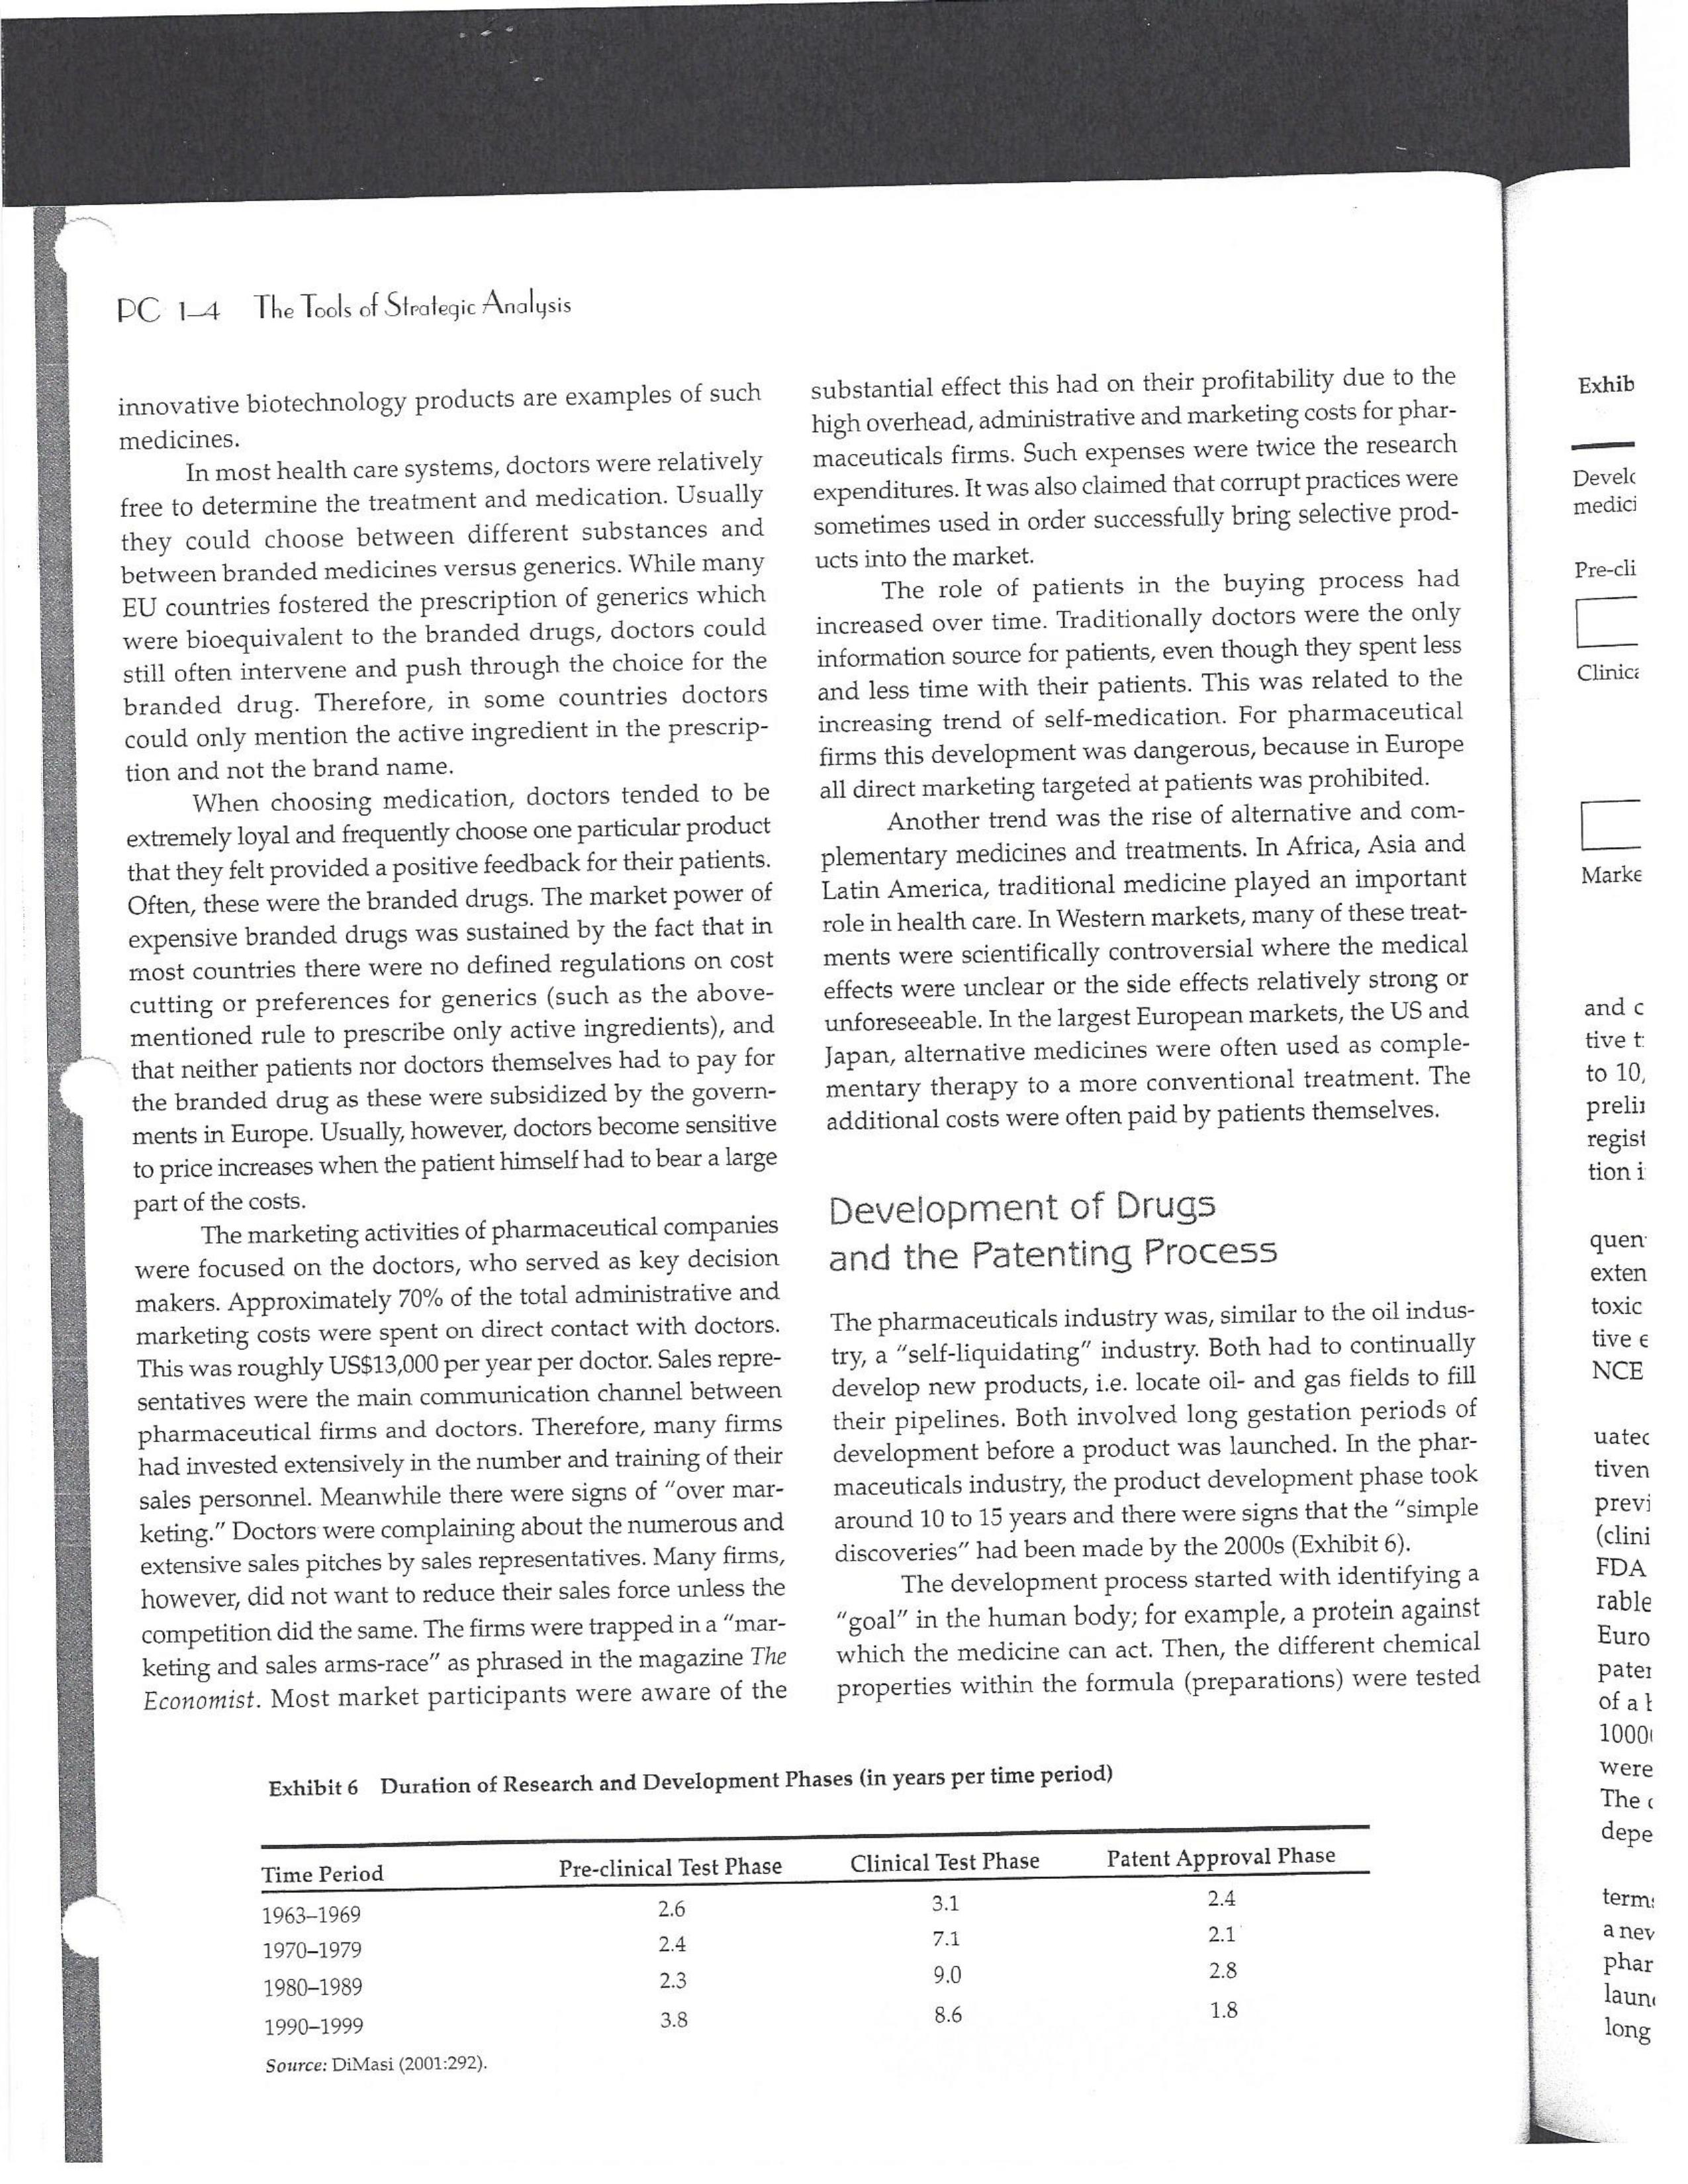
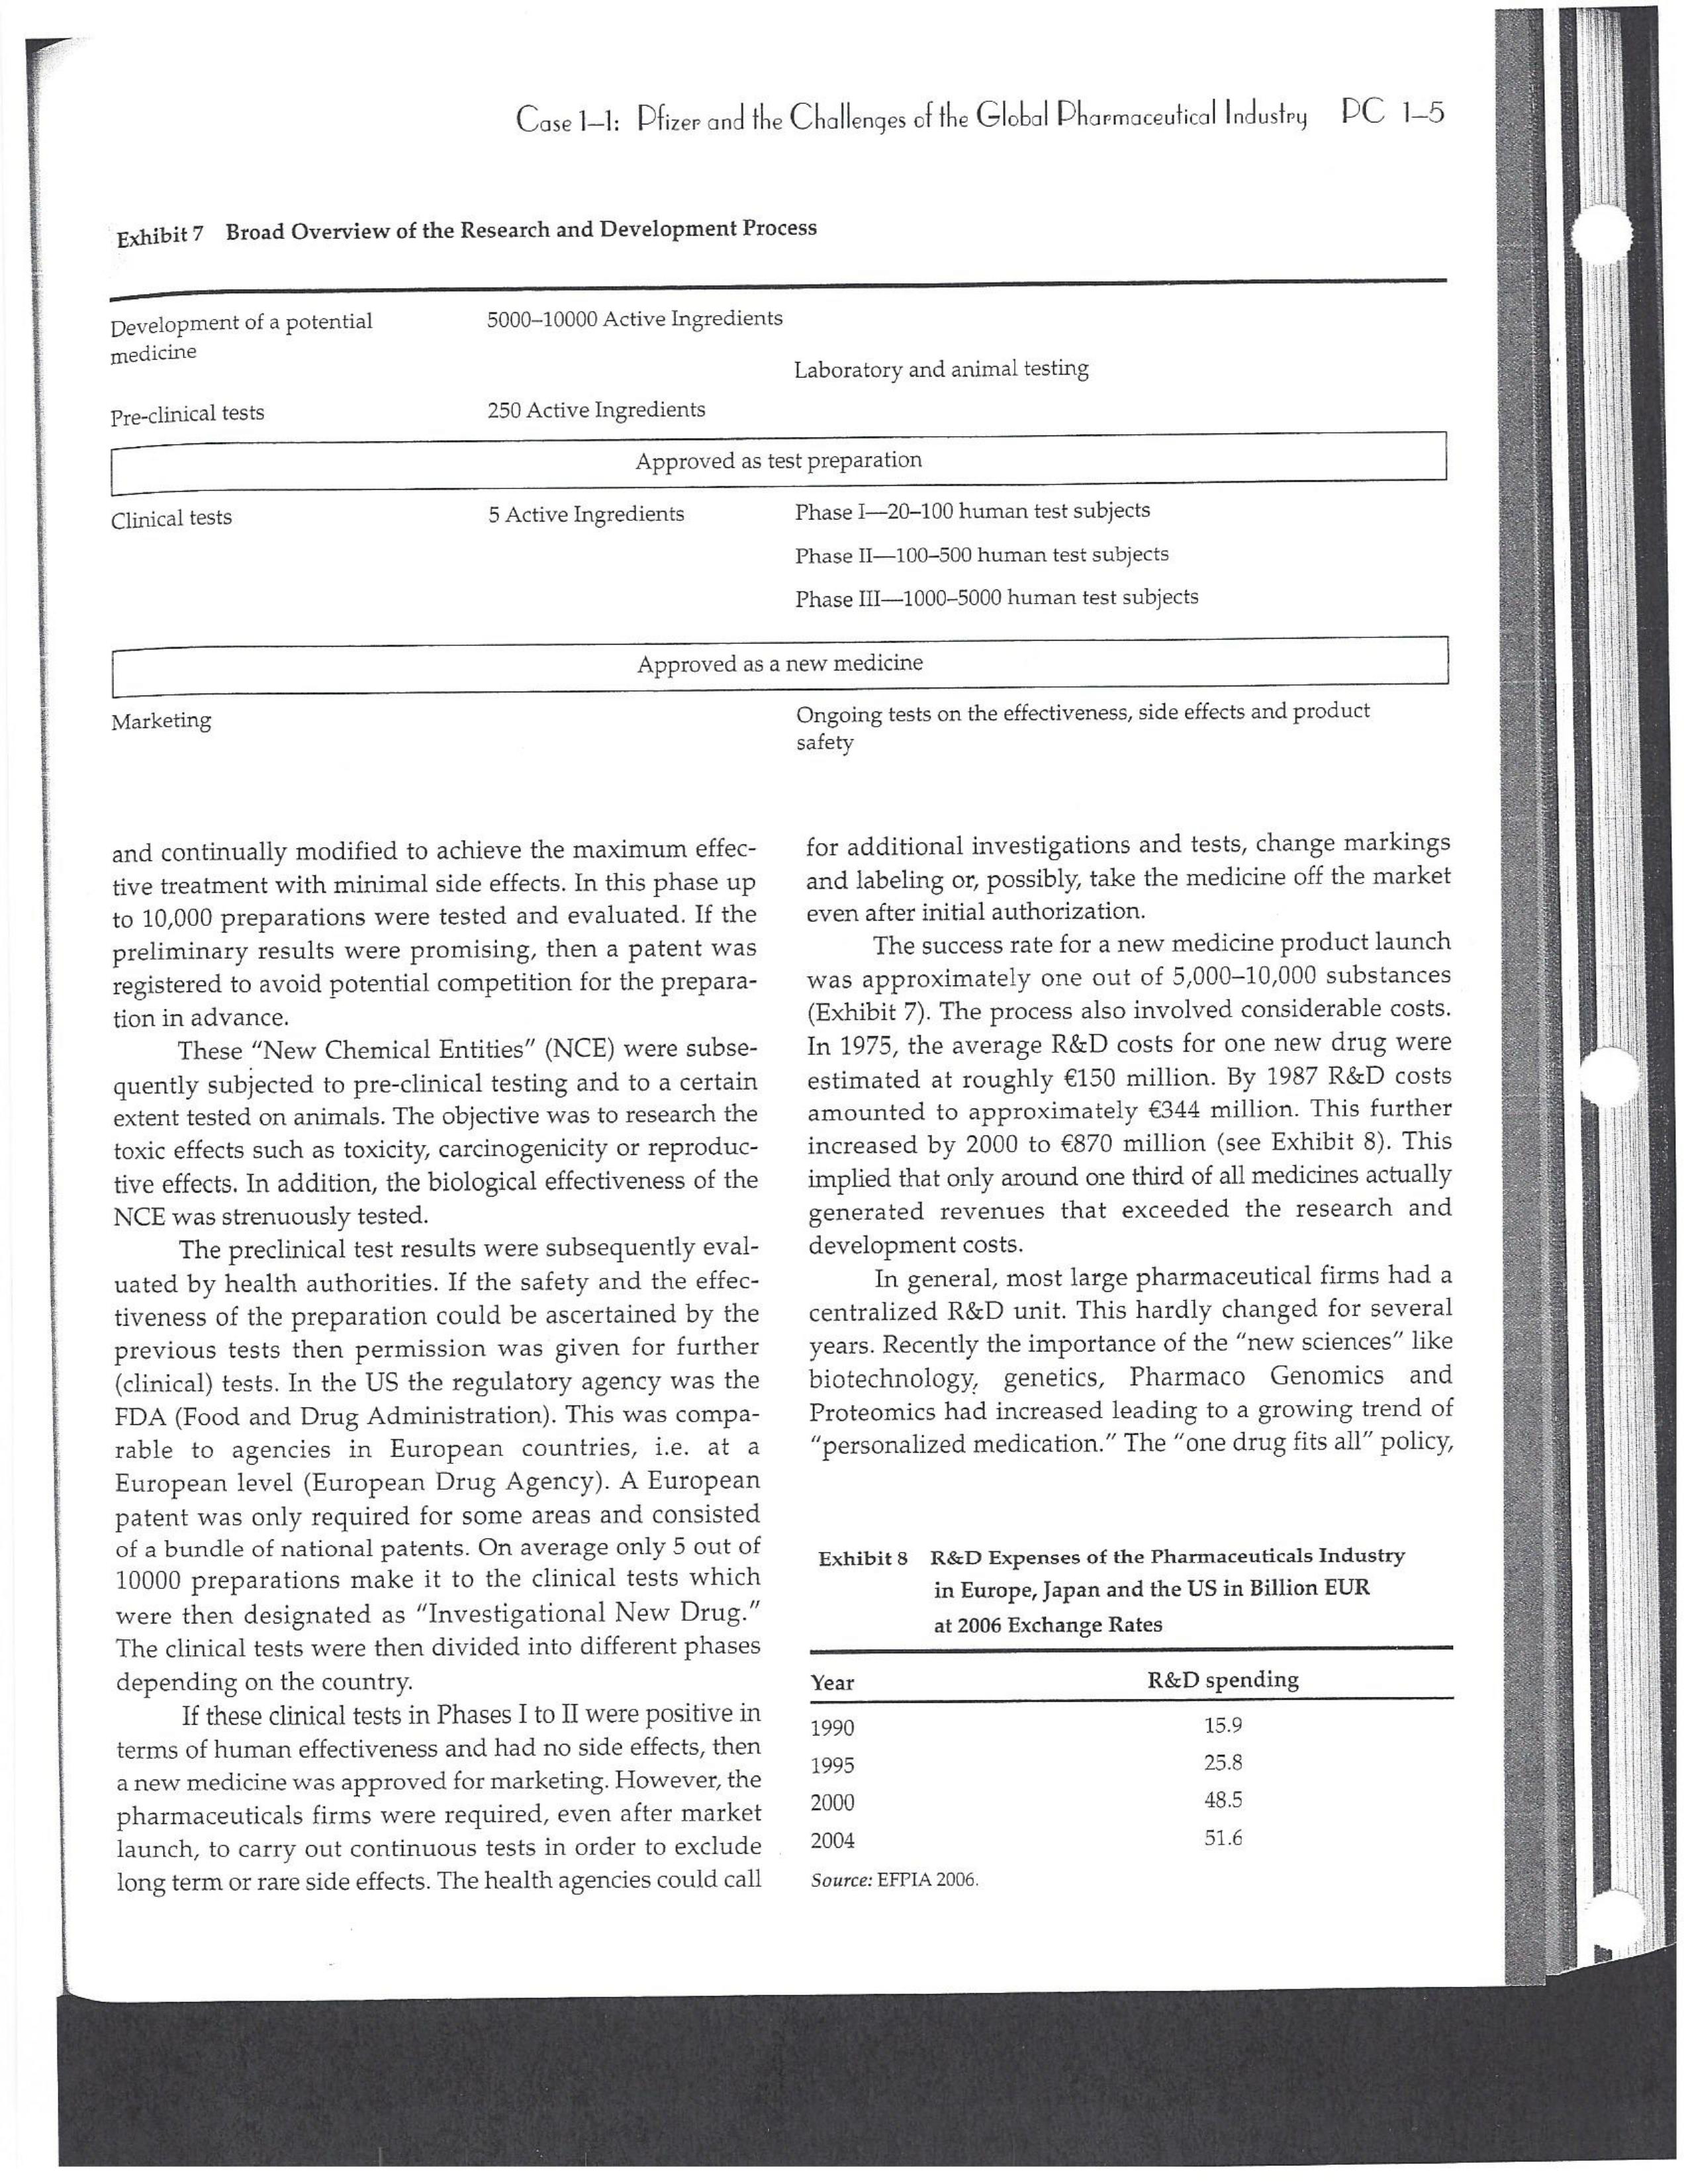
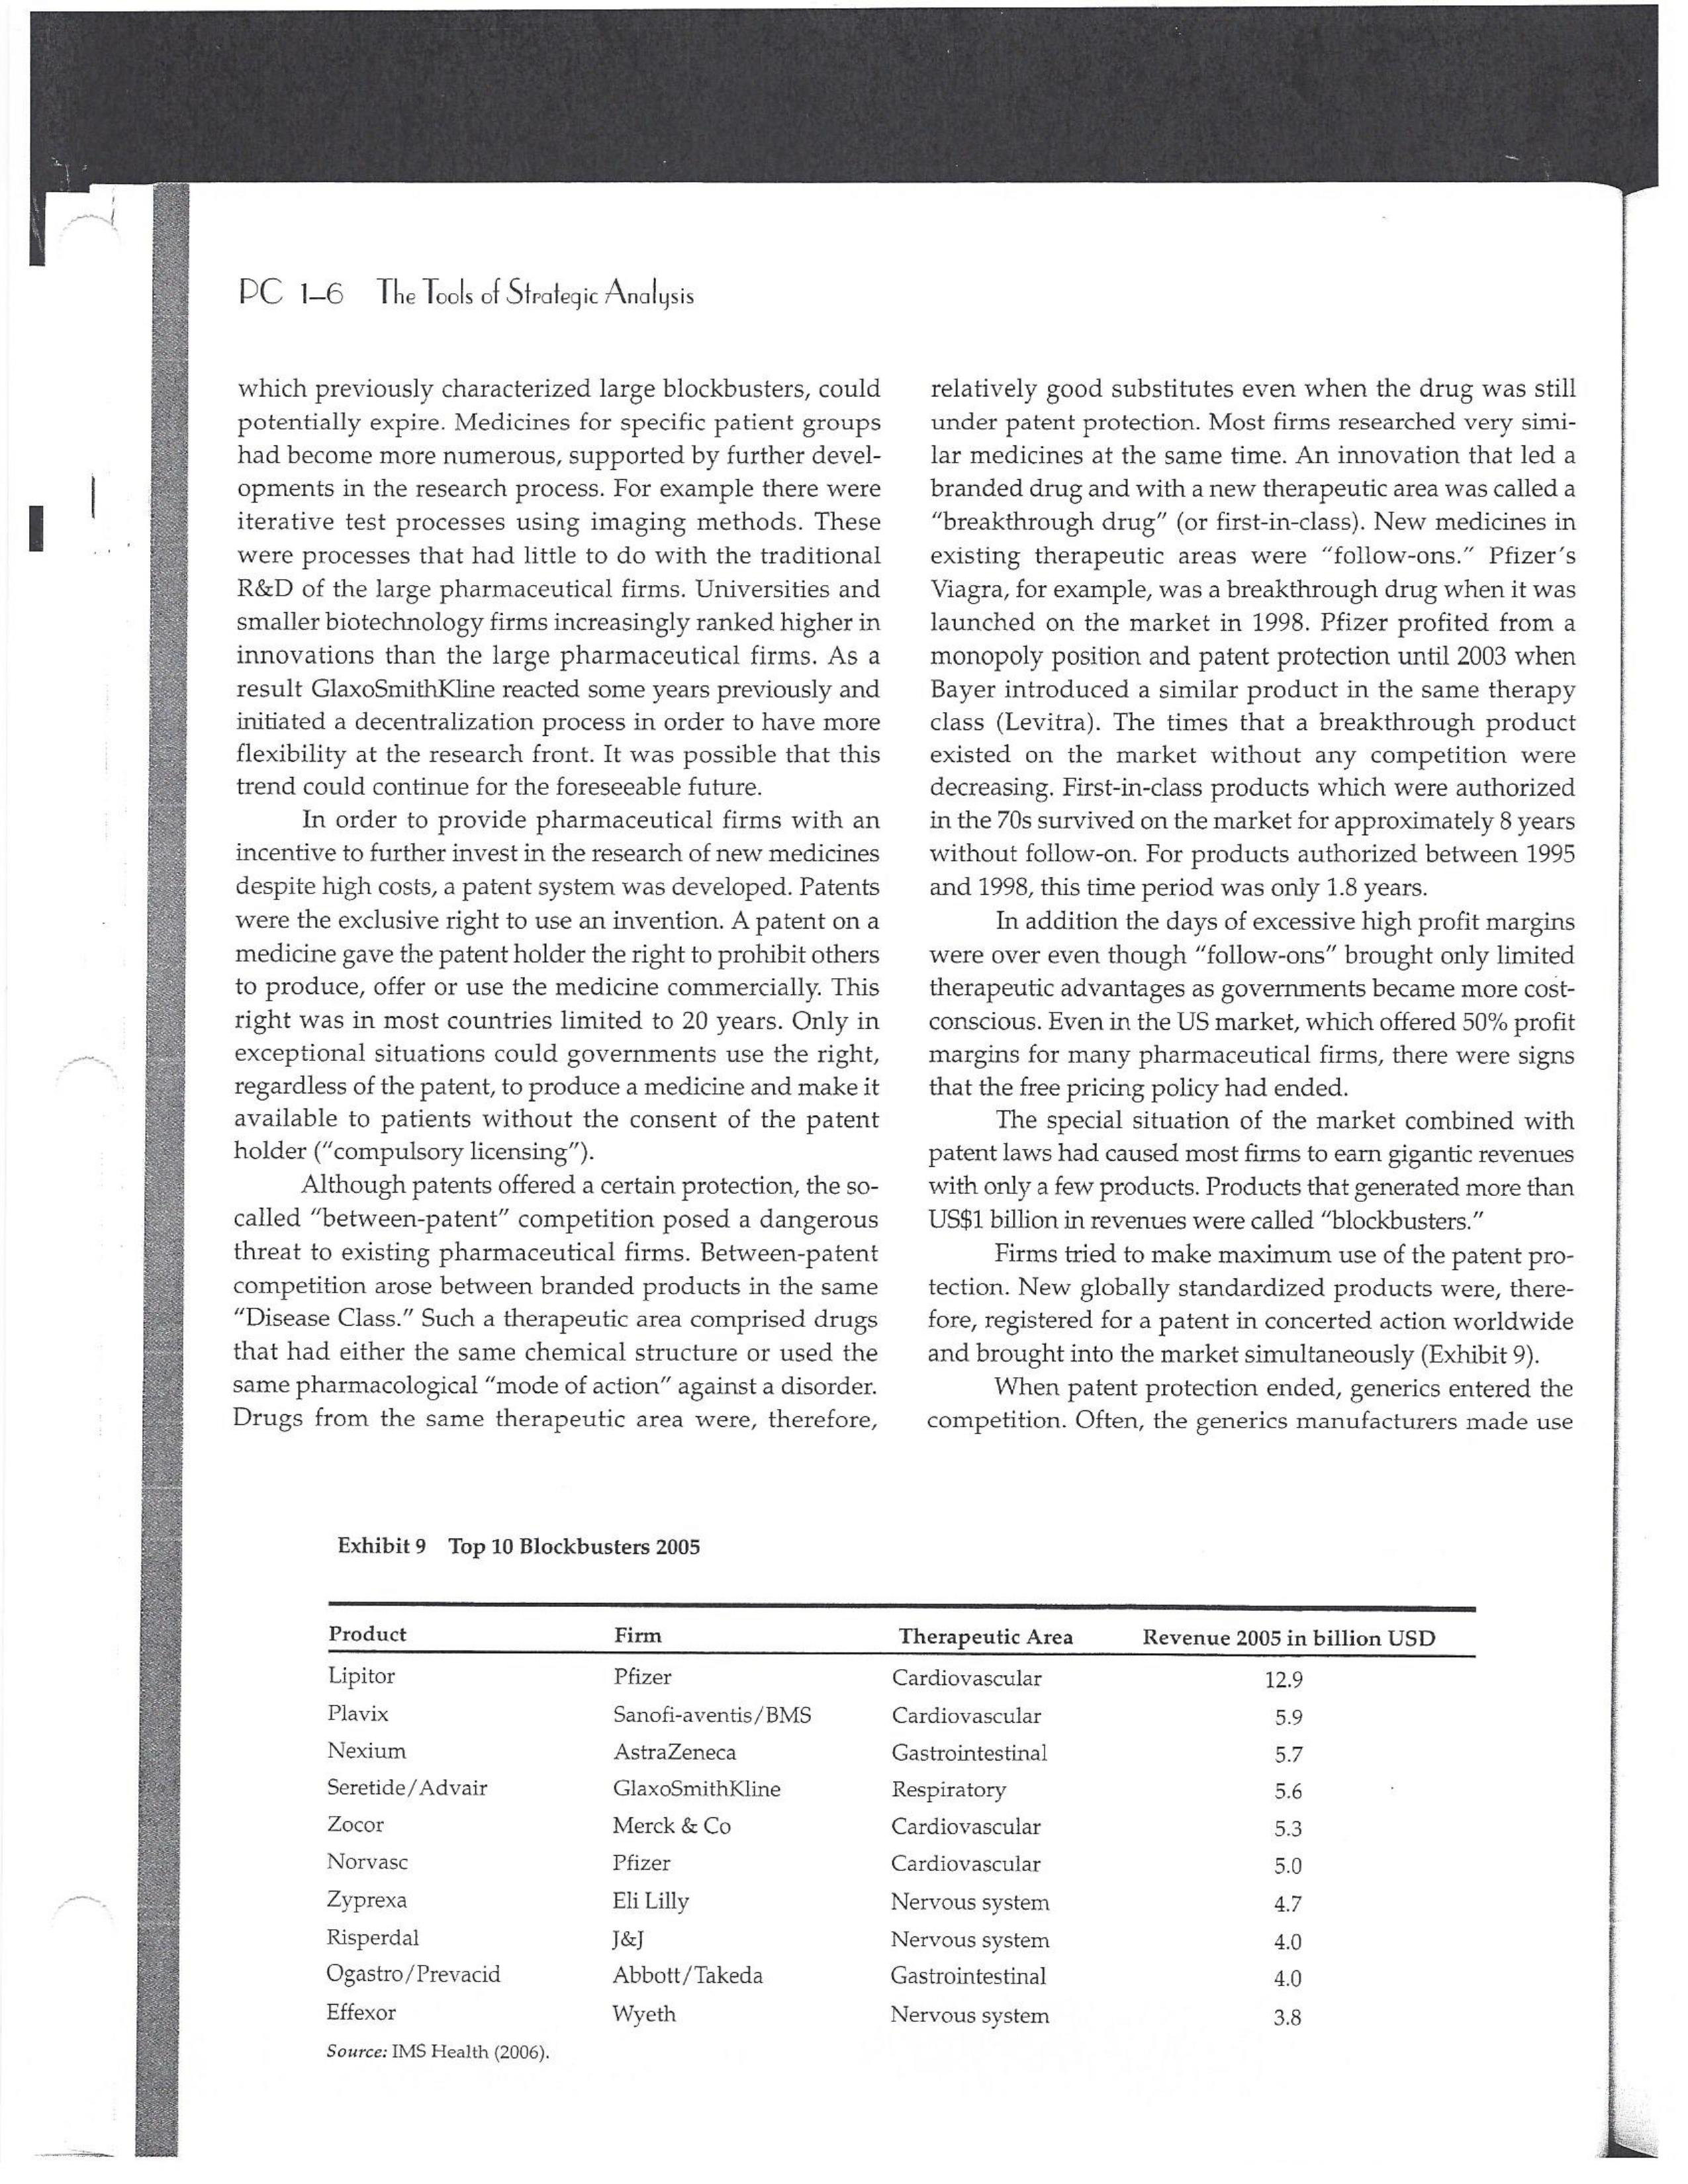
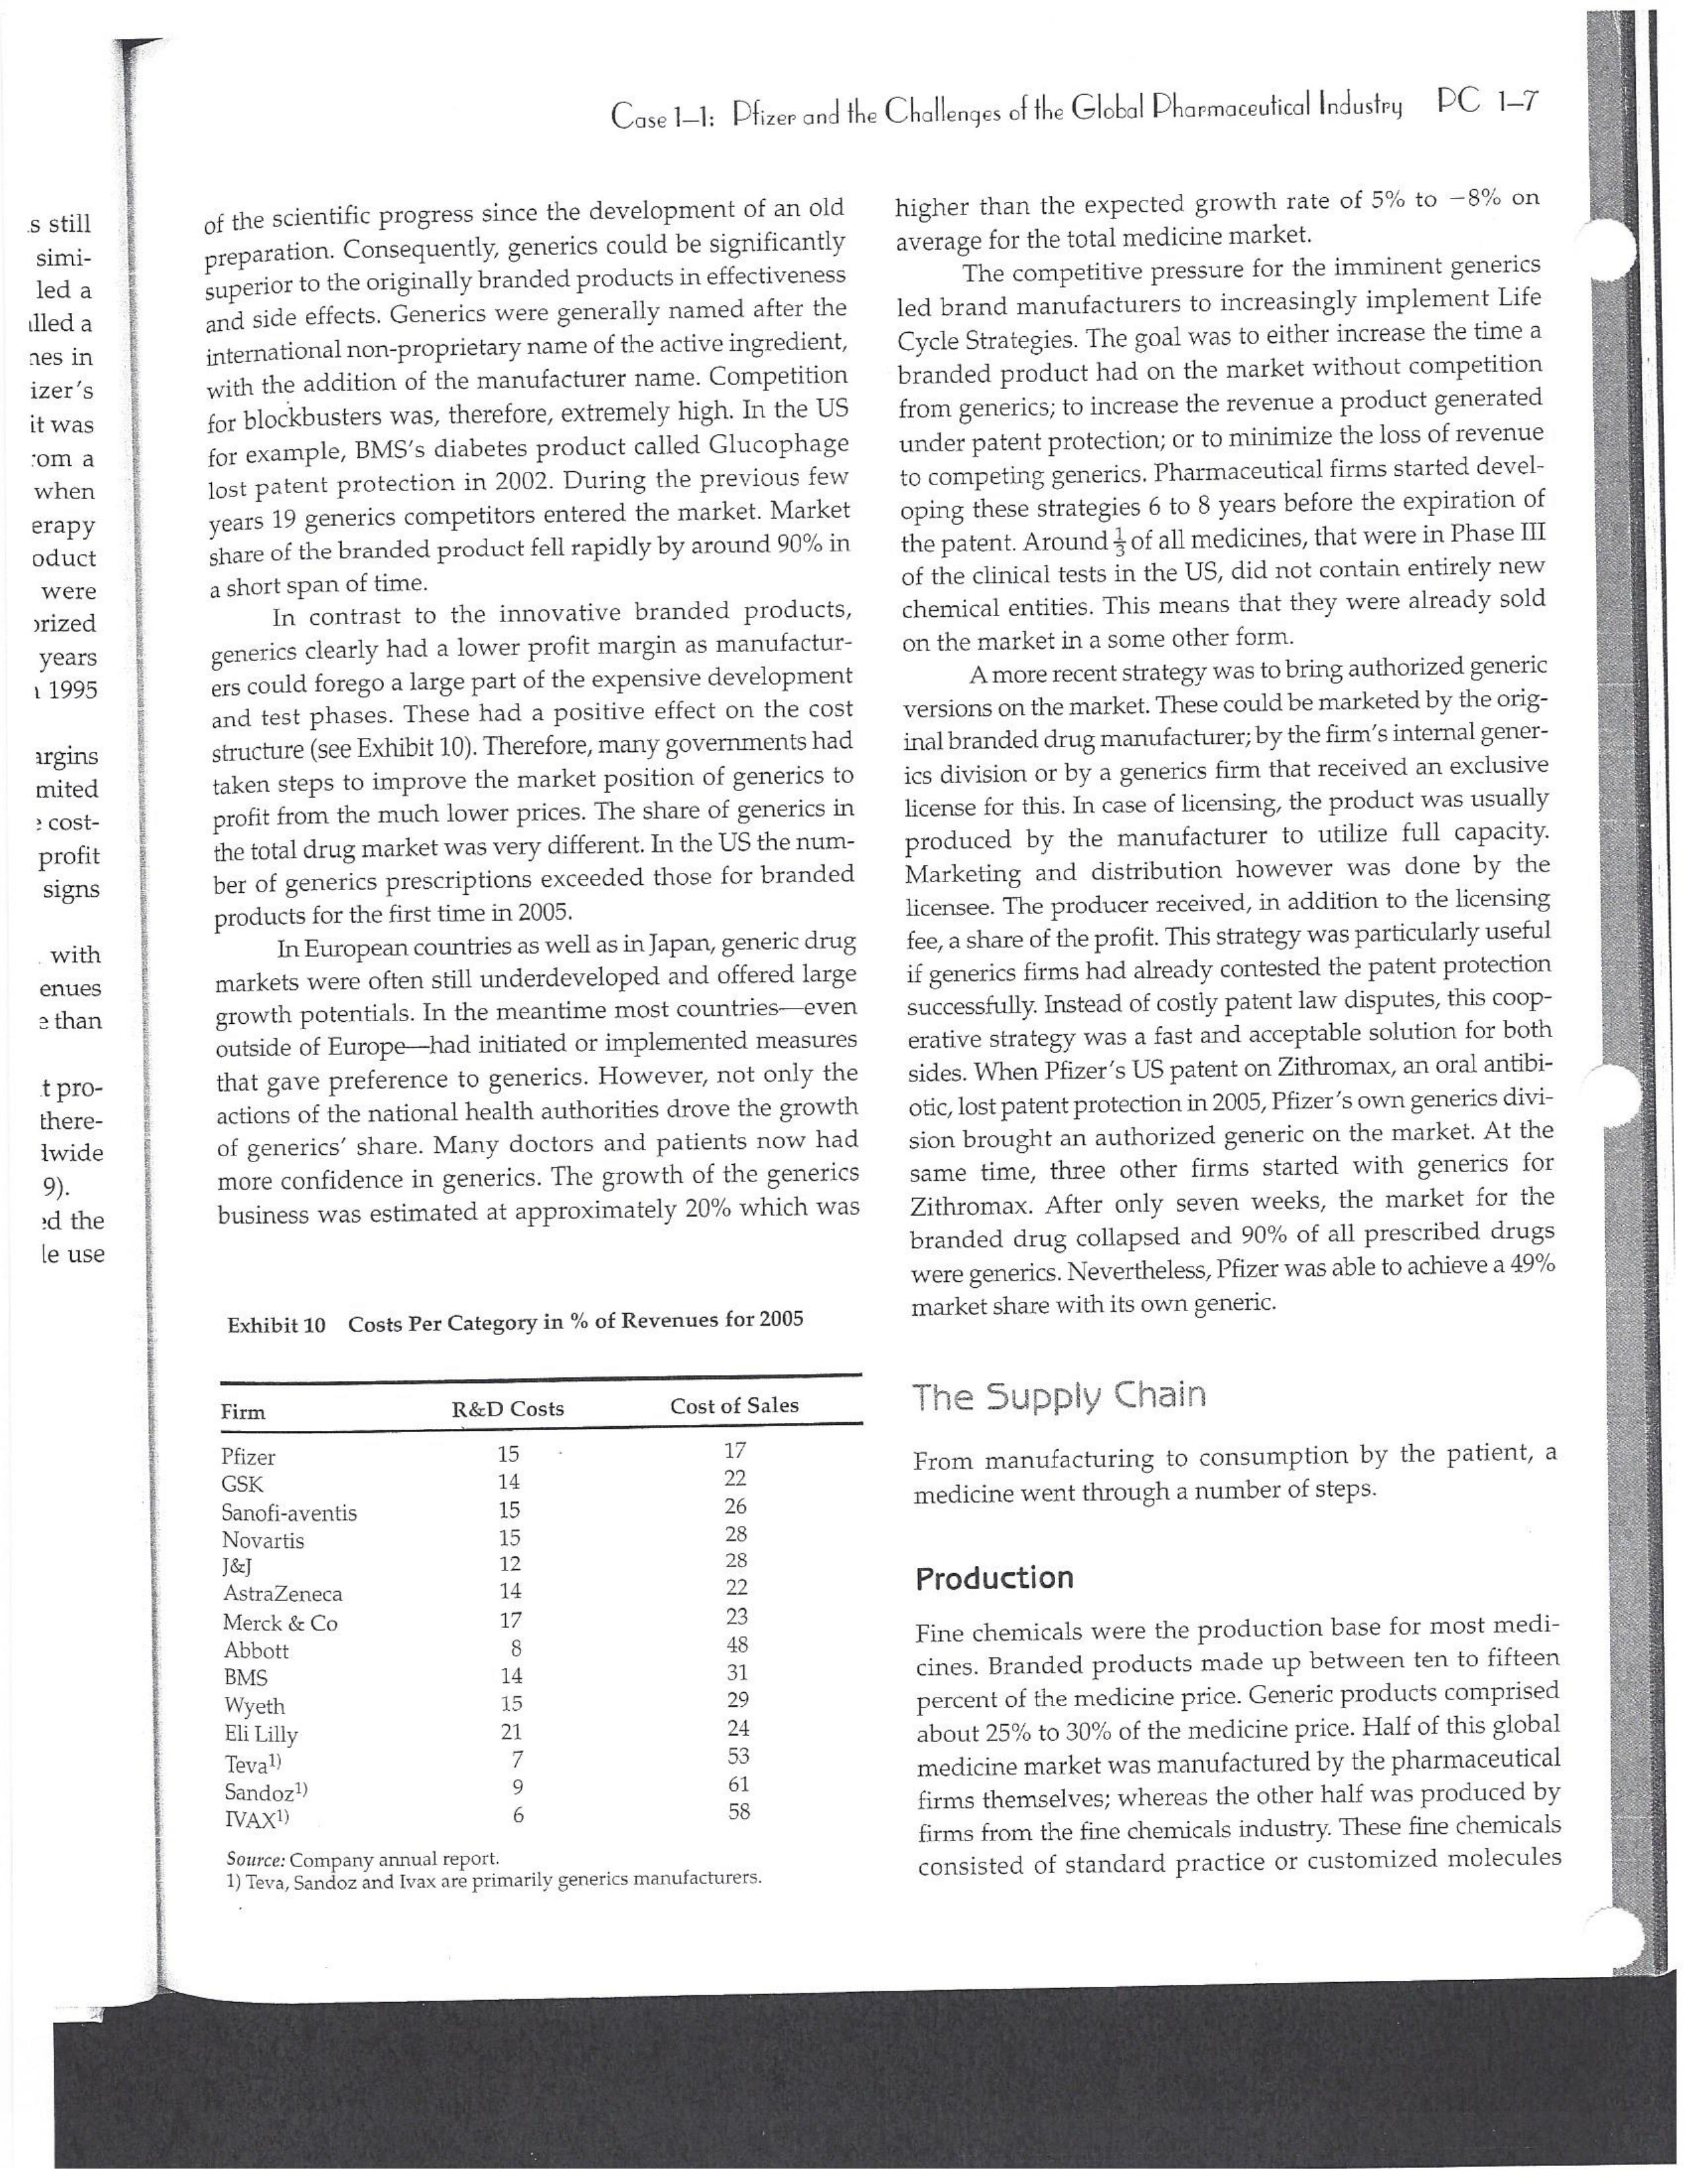
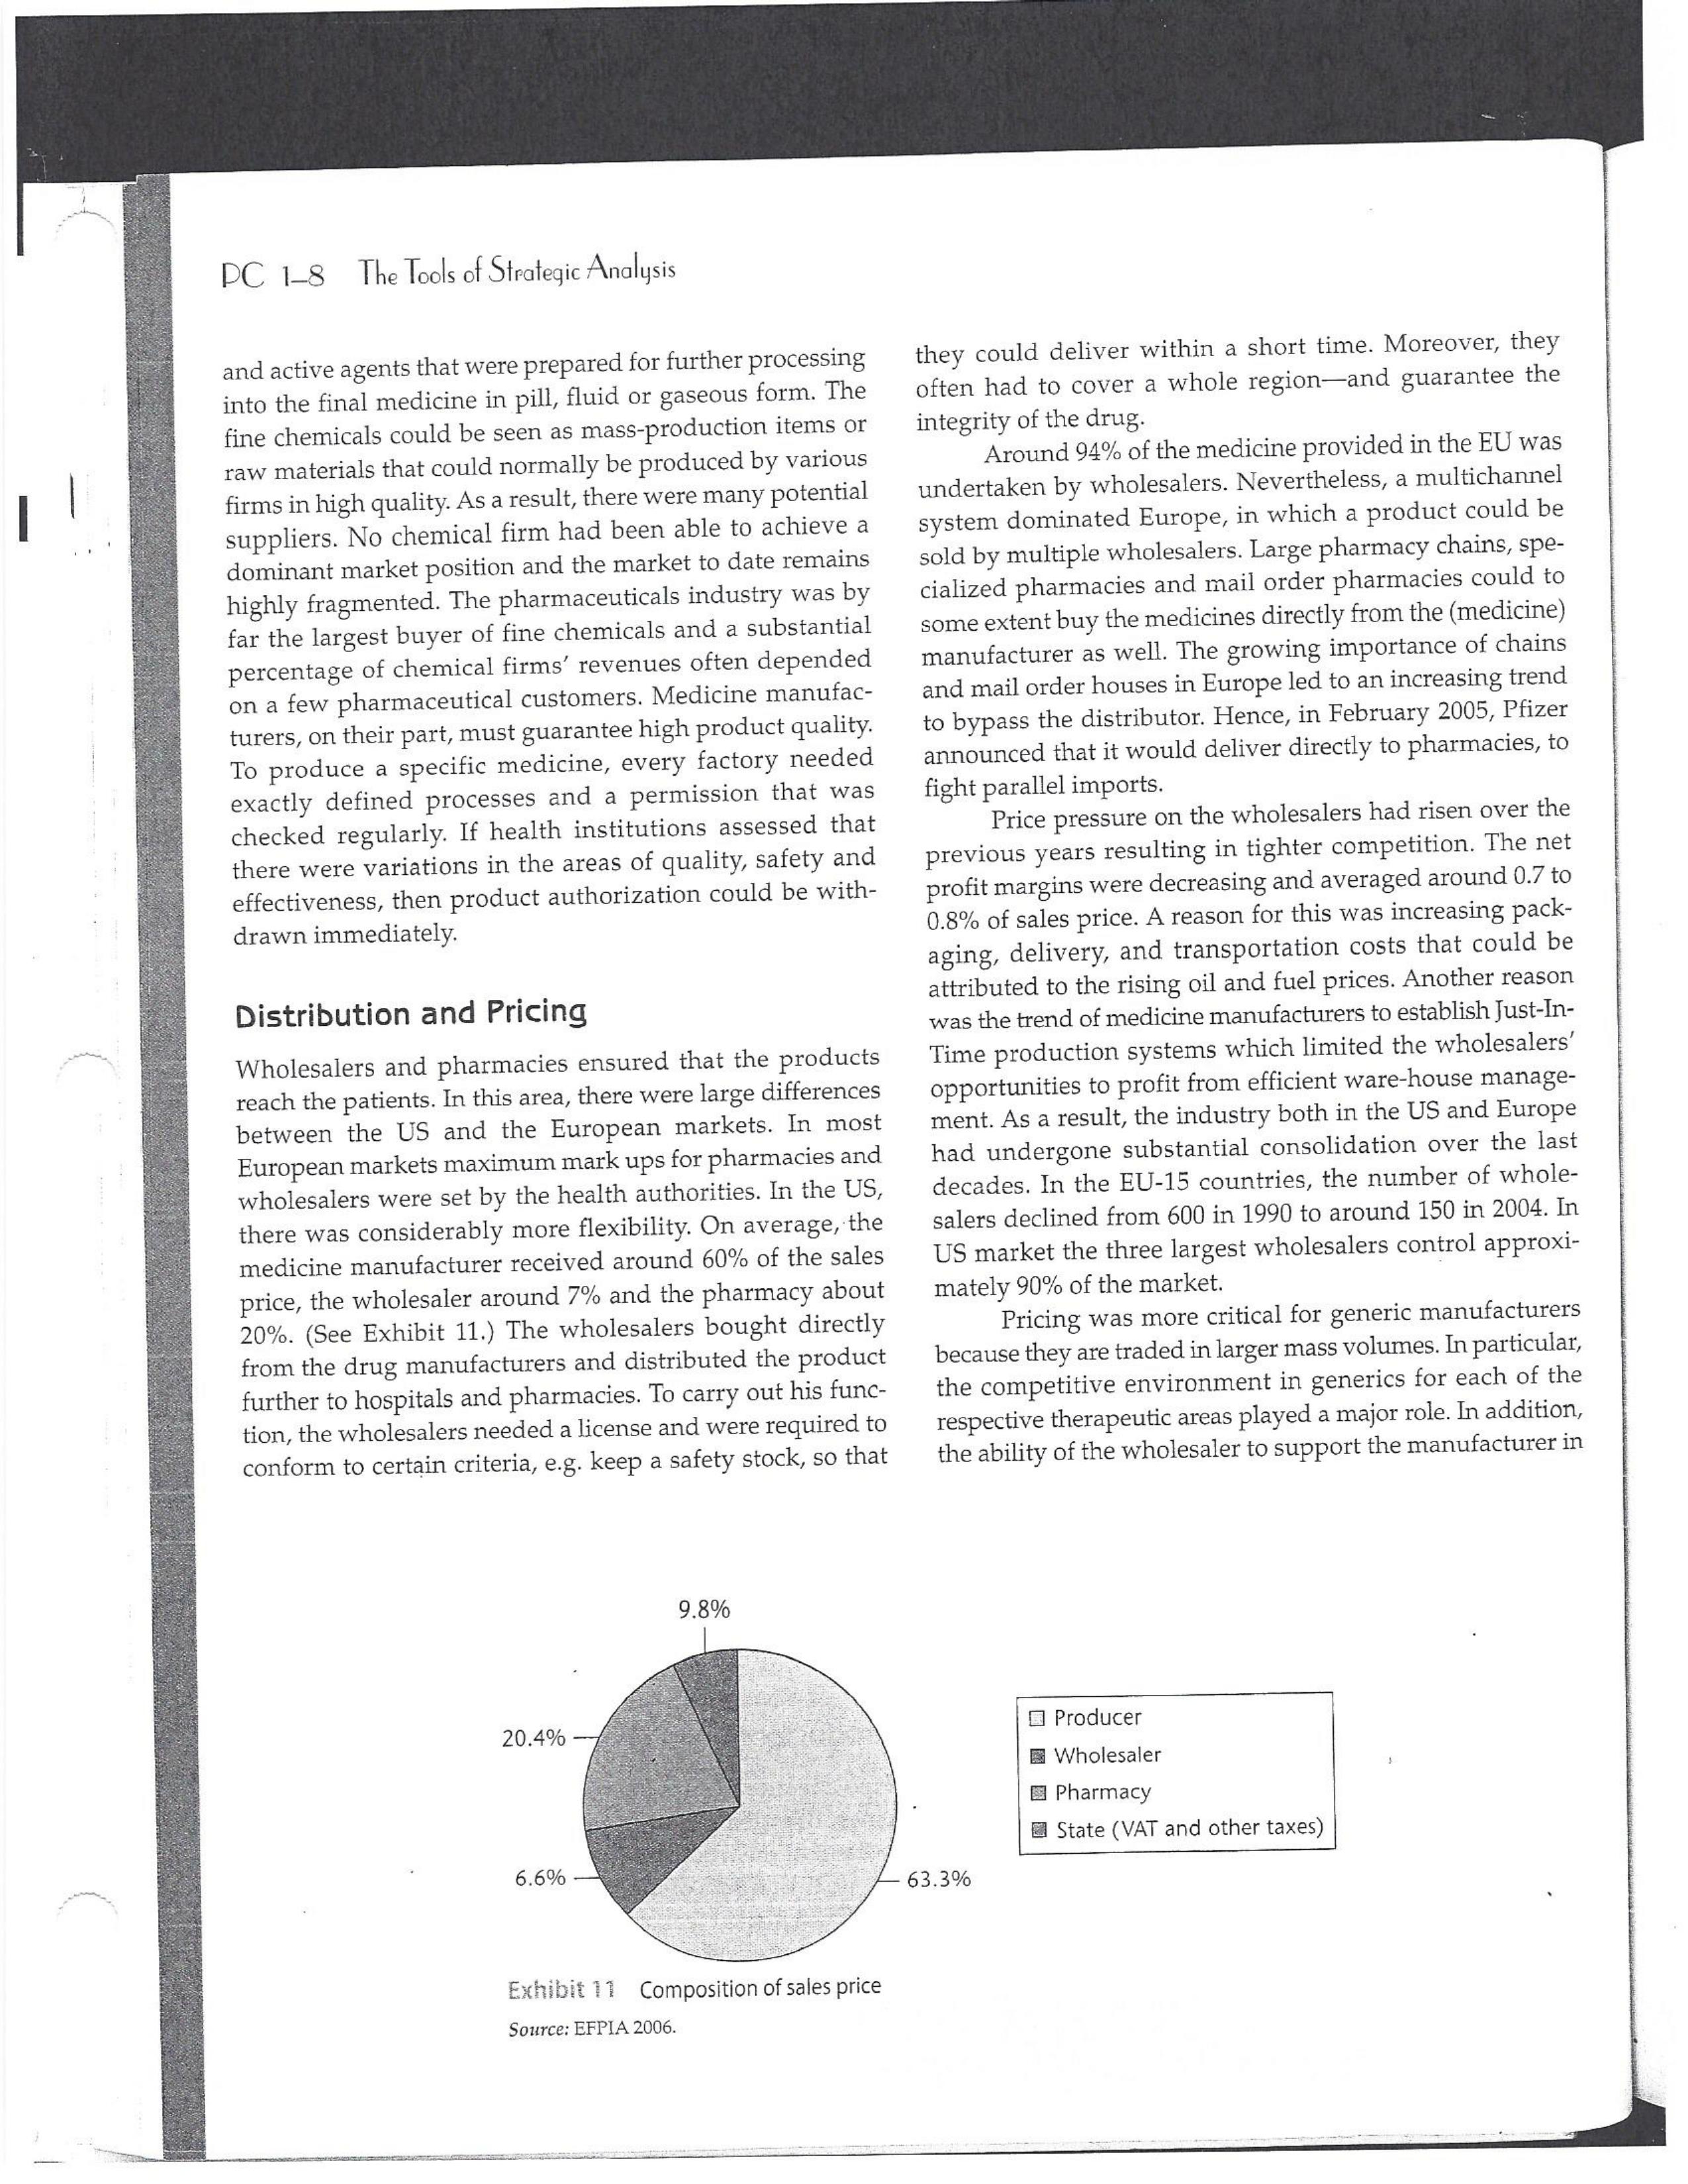
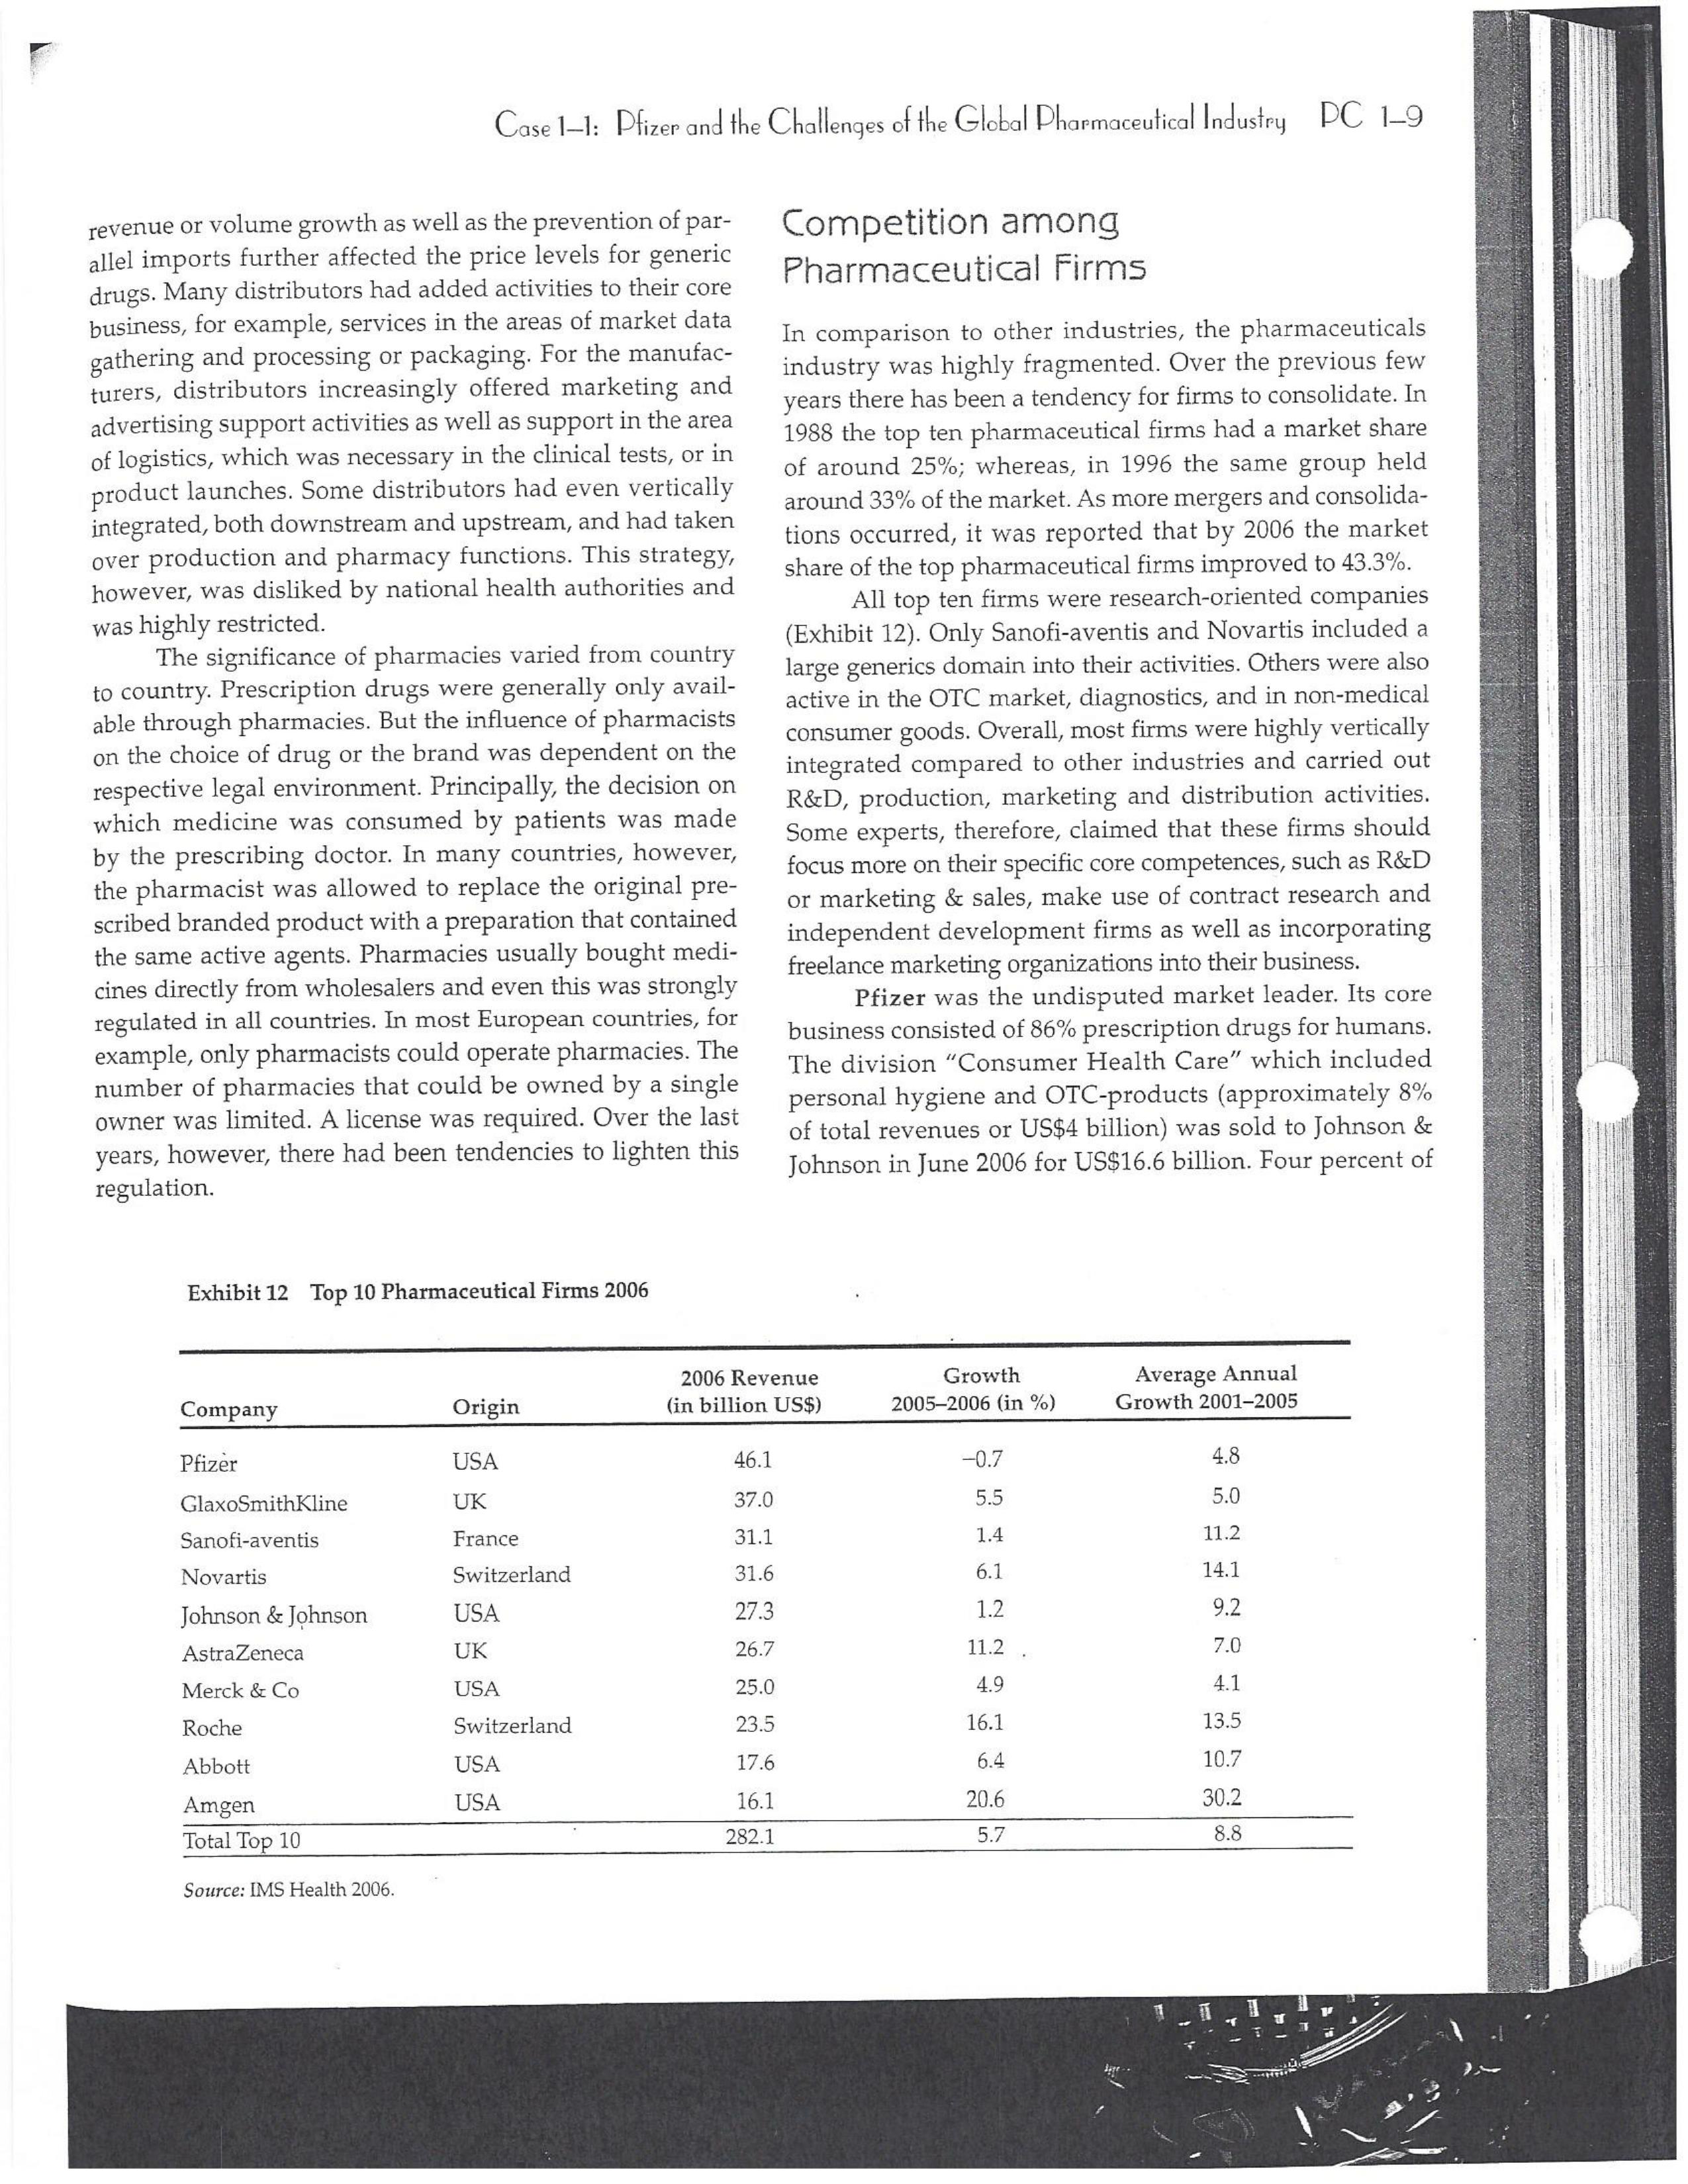
PAR T CASES Case 1-1: Pfizer and the Challenges of the Global Pharmaceutical Industry* Introduction-Pfizer The general changes and industry developments worried many pharmaceutical managers. One area of In the beginning of 2007 Jeffrey Kindler, Pfizer's new chair- concern was the role and influence of pharmaceutical firms man, pondered over the company's stagnating performance. on price setting. In 2005 the German government demanded Growth had slowed down recently and the company could price reductions across the board for all types of drugs. For not achieve its annual goals. Having just joined the example, the German government wanted to reimburse the company, Kindler still had to spend time to learn about medical expenses of Lipitor patients up to a certain the pharmaceutical industry and Pfizer's strategic position. amount. If the price of Lipitor was further reduced by 38%, His previous leadership of Mcdonald's had proven to be a then German patients could receive full reimbursement for success story. Now the switch to Pfizer proved to be a chal- their purchase cost. Previously, the German government lenge as Pfizer's shareholders continued to be disap had already negotiated the lowest possible price for Lipitor. pointed with the company's recent developments. This dual step price reduction had a drastic effect on the Not only had revenues declined but also the block- potential earnings of Pfizer. buster drug called "Lipitor" was losing its momentum. Price pressures existed not only in Germany. On the Lipitor is a cholesterol-lowering drug that had contributed 1st of January 2005, the Pharmaceutical Price Regulation US$13 billion in sales. This comprised 40% to total company's Scheme ("PPRS") came into effect in the United Kingdom. profit. In December 2006, Pfizer faced a setback in developing The PPRS's goal was to set profit boundaries on all types of "Torcetrapib" which should have been the "blockbuster" suc- medicines. Kindler's colleague Tom Mckillop, the CEO cessor for Lipitor. The research program for "Torcetrapib" was of AstraZeneca, spoke of an "Extortion like" situation. stopped due to significant concerns regarding human safety. Felix Raeber, head of European media relations for Drastic side-effects had risen unexpectedly resulting in finan- Novartis referred to a situation where the pharmaceutical cial investment losses for Pfizer. companies were "without control."2 In addition, managers were also worried about the public recognition and evaluation of the activities of phar- This case was written by Dr. Phillip Nell, Center for Strategic maceutical firms. Normally the efforts of drug companies to Management and Globalization at Copenhagen Business School develop new medicines were accepted favorably by the gen- and Dr. Bjorn Ambos, Institute for International Marketing and Management at Wirtschaftsuniversitat Wien. It is intended to be used eral public. However, pharmaceutical firms had a negative as the basis for class discussion rather than to illustrate either effect image during the previous few years. A survey in the US tive or ineffective handling of a management situation. The case was showed that only 14% of the respondents had a very posi- compiled from published sources and generalised experience. five impression of the pharmaceutical industry. Fifty per- Dr. Phillip C. Nell is Assistant Professor at the Center for cent of the respondents had a bad impression. This implied Strategic Management and Globalization at Copenhagen Business the pharmaceutical industry had a reputation similar to oil School and tobacco companies. Historically, the pharmaceutical 2 Dr. Bjorn Ambos is Professor and head of the Institute for industry had been one of the most profitable and high International Marketing and Management at Wirtschaftsuniversitat margin industries for many years. Could the industry con- Wien tinue to sustain such trends given ongoing changes?DC lQ The Tools of Sipaleqic Anolqsis Exhibit 1 Development of Total Expenditures on Health Per Capita in USD Purchasing Power Parity _________._._ 1960 1970 1980 1990 2000 2001 2002 2003 _________________--- North America 136 326 928 Europe 69 202 641 Japan 30 149 580 Asia /Pacific 94 232 455 Latin America OECD average 79 214 639 Source: OECD Health Data 2006. The Pharmaceutical Industry Global health expenses increased steadily during the last decades. In 2003, the average per capita spending on health care in OECD countries amounted to US$2,400. (Refer to Exhibit 1.) The health expense measured as a proportion of gross domestic product rose from 7.8% in 1997 to 8.8% in 2003. Currently, medicines comprised 18% of global health expenses with a tendency to increase in the near future. The reasons for this were numerous. First, the proportional increase of the ageing population in most countries led to a larger demand of medicinal usage (Exhibit 2). Second, there was a need to develop innovative and expensive medicines during the last few decades especially for new strains of dis- eases such as cancer and AIDS which had previously no cure. In this case, differences among countries could be ' observed due to differences in consumption patterns, medi- cine prices as well as income levels. (See Exhibit 3.) During recent years medication expenditures had risen faster than total health spending. The global medicine market amounted to US$643 billion in 2006. (See Exhibit 4 below.) The medicine product market was segmented based on various categories depending on the chemical composition, safety and frequency of usage. The rst cate- gory was whether a prescription was required. Prescription drugs can only be given out by doctors and pharmacies. Exhibit 2 Share of Elderly People (265) of the Total Population in % 1960 2003 UK 12 16 US 9 12 Italy 9 19 Iapan 6 19 OECD 9 14 2.245 3.546 3.826 4.093 4.355 1.165 1.934 2.075 2.253 2.409 1.116 1.967 2.082 2.138 2.249 887 1.594 1.725 1.842 1.949 306 506 548 578 608 1.180 1.961 2.106 2.275 2.427 Exhibit 3 Per Capita Expenditures on Pharmaceutical Products in USD for Selected Countries _____ Per capita expenditures on pharmaceutical products Land in USD purchasing power parity in 2003 US 728 France 606 Germany 436 Italy 498 Sweden 340 Poland 225 Mexico 125 Turkey 112 Source: OECD Health at a Glance, OECD Indicators 2005. The second category was called overrthe-counter-drugs or \"OTC.\" These are medicines purchased without a prescrip- tion. This category also includes food supplements and vitamins. The latter were not classied as medicines and were sold in pharmacies and, in the US, in supermarkets. The OTCmarket was comparable to the consumer goods markets.3 In the prescription drug market, a distinction was drawn between generics and branded drugs. A generic (multiple generics) was a medicine that had the same active agents as a branded drug. In other words, a generic was a copy of branded drug that patent had expired. Generics are marketed only the after the patent expires. Health systems in Europe and in the US were funda- mentally different. In the US, there was no public health insurance to reimburse patients for the costs of medicines completely or partly. The large majority of the Americans were, therefore, privately insured. The US government seldom got involved with price regulation. Consequently, the US market offers the highest prices worldwide and was by far the most important market for the pharmaceutical industry. In most European COuntries there was compulsory health insurance supported by the state and accessible for the whole population. A large portion of the drug expenses were paid by the state. In 2001, the share of public Case Ll: Dlizen and lhe Challenges ol lhe Global Dhanmoceulicol lnclusiru DC 13 Exhibit 4 Development of the Global Pharmaceutical Market _______________- 2002 2003 2004 2005 2006 2007 2008 Year 1998 1 775 427 498 559 601 643 712 999 2000 2001 Total global sales 298 334 362 387 (in US$ billions exmanufacture price) Growth rate (in % at a 14.5 11.7 11.8 constant US$) Source: IMS Health (2009). spending to total spending added up to 72% on average in OECD countries. The other 28% of the expenditures were funded privately by private insurance or by patients. This average, however, did not show the significant disparities between some countries. In addition, there were consider able differences relating to the share of public and private nancing sources within medicine expenditures (Exhibit 5). On average 60% of medication expenses in OECD countries were financed publicly. Based on this, the national health systems were the basic principal payer for medicines in Europe. Considering the increasing health care spending and tight national budgets, the European governments were considerably more active Exhibit 5 Public and Private Spending on Pharmaceuticals Per Country in % of Total Spending ___________- Public spending Private spending US 21% 79% Canada 38% 62% Switzerland 66% 34% Norway 59% 41% Iceland 58% 42% UK 64% 36% Sweden 70% 30% Spain 74% 26% Slovakia 83% 17% Portugal 66% 34% Poland 410/0 59% Netherlands 57% 43% Luxembourg 83% 17% Italy 49% 51% Ireland 86% 14% Hungary 63% 37% Greece 74% 26% Germany 75% 25% France 67% 33% Finland 54% 46% Denmark 49% 51% Czech Republic 77% 23% Belgium 45% 55% Austria 70% 30% Source: OECD Health Data 2006. 10.6 10.4 8.0 6.8 7.1 6.4 5.3 in price regulation. To achieve this, the governments used various measures. One of these measures was setting xed prices in negotiations between the state and the manufacturer. This involved lengthy price and reimbursement negotia tions which could delay product launch signicantly. Governments could also set prices by socalled \"ref- erencing.\" The price of drugs were adjusted to the prices of other countries. Also \"internal referencing\" was employed where products with similar therapeutic effect were grouped together and a relatively lower all-in price is determined for every group. The reimbursement system was then aligned so that the patient must pay for the drug himself if the drug price was higher than the reference price. Other measures taken by governments were "allin price markdowns\" that were demanded from all manufacturers and the limitation on prot margins for certain products such as the PPRS system in the UK. Despite the mechanism of \"referencing,\" the differ- ent price regulation schemes led to considerable price differences within the European markets. For products that entered the market in Europe in 2000, a price range of 30% over and under the EU average price existed. This price control, combined with the free transportation of goods within the EU, resulted in parallel imports during the previous years. This led to forgone profits of approxi mately three to four billion Euros for the pharmaceuticals industry. Governments influenced not only the price, but also the demand through the reimbursement system of their respective health care institutions/authorities. Patients often could only get their medicine expenses repaid if the drug was recognized as reimbursable by their national health care system. Many countries established socalled positive lists where all products on the list were reimbursed, negative lists Where all products on the list were not reimbursed, or both. When a prescription drug was not reimbursed, the demand for this drug was automatically limited. Premium prices and the reimbursement of costs were mostly achieved by medicines that brought thera- peutic advantages: \"First-inclass products\" and highly DC 14 The Tools of Slmleqic Anolusis innovative biotechnology products are examples of such medicines. In most health care systems, doctors were relatively free to determine the treatment and medication. Usually they could choose between different substances and between branded medicines versus generics. While many EU countries fostered the prescription of generics which were bioequivalent to the branded drugs, doctors could still often intervene and push through the choice for the branded drug. Therefore, in some countries doctors could only mention the active ingredient in the prescrip- tion and not the brand name. When choosing medication, doctors tended to be extremely loyal and frequently choose one particular product that they felt provided a positive feedback for their patients. Often, these were the branded drugs. The market power of expensive branded drugs was sustained by the fact that in most countries there were no defined regulations on cost cutting or preferences for generics (such as the above- mentioned rule to prescribe only active ingredients), and ' that neither patients nor doctors themselves had to pay for the branded drug as these were subsidized by the govern- ments in Europe. Usually, however, doctors become sensitive to price increases when the patient himself had to bear a large part of the costs. The marketing activities of pharmaceutical companies were focused on the doctors, who served as key decision makers. Approximately 70% of the total administrative and marketing costs were spent on direct contact with doctors. This was roughly US$13,000 per year per doctor. Sales repre- sentatives were the main communication channel between pharmaceutical firms and doctors. Therefore, many firms had invested extensively in the number and training of their sales personnel. Meanwhile there were signs of \"over mar- keting." Doctors were complaining about the numerous and extensive sales pitches by sales representatives. Many rms, however, did not want to reduce their sales force unless the competition did the same. The firms were trapped in a \"mar keting and sales armsrace\" as phrased in the magazine The Economist. Most market participants were aware of the substantial effect this had on their protability due to the high overhead, administrative and marketing costs for phar- maceuticals firms. Such expenses were twice the research expenditures. It was also claimed that corrupt practices were sometimes used in order successfully bring selective prod- ucts into the market. The role of patients in the buying process had increased over time. Traditionally doctors were the only information source for patients, even though they spent less and less time with their patients. This was related to the increasing trend of self-medication. For pharmaceutical firms this development was dangerous, because in Europe all direct marketing targeted at patients was prohibited. Another trend was the rise of alternative and com- plementary medicines and treatments. In Africa, Asia and Latin America, traditional medicine played an important role in health care. In Western markets, many of these treat- ments were scientifically controversial where the medical effects were unclear or the side effects relatively strong or unforeseeable. In the largest European markets, the US and Japan, alternative medicines were often used as comple- mentary therapy to a more conventional treatment. The additional costs were often paid by patients themselves. Development of Drugs and the Patenting Process The pharmaceuticals industry was, similar to the oil indus try, a \"self-liquidating\" industry. Both had to continually develop new products, i.e. locate oil- and gas fields to fill their pipelines. Both involved long gestation periods of development before a product was launched. In the phar- maceuticals industry, the product development phase took around 10 to 15 years and there were signs that the "simple discoveries\" had been made by the 20005 (Exhibit 6). The development process started with identifying a "goal" in the human body; for example, a protein against which the medicine can act. Then, the different chemical properties within the formula (preparations) were tested Exhibit 6 Duration of Research and Development Phases (in years per time period) ___________________ Time Period Pre-clinical Test Phase _______________________- 19631969 2.6 19701979 2.4 1980-1989 2.3 1990-1999 3.8 Source: DiMasi (2001:292). Clinical Test Phase Patent Approval Phase 3.1 2.4 7.1 2.1 ' 9.0 2.8 8.6 1.8 Exhib Develr medici Pre-cli Clinic: Marks and c tive t to 10, prelii regisl tion i quen- exten toxic tive c NCE uatec tiven previ (Clini FDA rable Euro pater of a t IOUOI Were The r depe 1rm: a nev phar laun. long CGSE' 1-]: pill?!" and \"18 Challenges 0f: \"'12 Global Dl'lOFmOCEUliCGI lnduslng DC 1'5 Ebit 7 Broad Overview of the Research and Development Process .________________--- Development of a potential 500010000 Active Ingredients medicine Laboratory and animal testing Pris-clinical tests 250 Active Ingredients Approved as test preparation Clinical tests 5 Active Ingredients Phase 120100 human test subjects Phase 11100500 human test subjects Phase IIIIOOOSOOO human test subjects Approved as a new medicine Ongoing tests on the effectiveness, side effects and product safety Marketing and continually modified to achieve the maximum effec- tive treatment with minimal side effects. In this phase up to 10,000 preparations were tested and evaluated. If the preliminary results were promising, then a patent was registered to avoid potential competition for the prepara- tion in advance. These \"New Chemical Entities\" (NCE) were subse- quently subjected to pre-clinical testing and to a certain extent tested on animals. The objective was to research the toxic effects such as toxicity, carcinogenicity or reproduc- tive effects. In addition, the biological effectiveness of the NCE was strenuously tested. The preclinical test results were subsequently eval- uated by health authorities. If the safety and the effec- tiveness of the preparation could be ascertained by the previous tests then permission was given for further (clinical) tests. In the US the regulatory agency was the FDA (Food and Drug Administration). This was compa- rable to agencies in European countries, i.e. at a European level (European Drug Agency). A European patent was only required for some areas and consisted of a bundle of national patents. On average only 5 out of 10000 preparations make it to the clinical tests which were then designated as \"lnvestigational New Drug.\" The clinical tests were then divided into different phases depending on the country. If these clinical tests in Phases I to II were positive in terms of human effectiveness and had no side effects, then a new medicine was approved for marketing. However, the pharmaceuticals firms were required, even after market launch, to carry out continuous tests in order to exclude long term or rare side effects. The health agencies could call for additional investigations and tests, change markings and labeling or, possibly, take the medicine off the market even after initial authorization. The success rate for a new medicine product launch was approximately one out of 5,00010,000 substances (Exhibit 7). The process also involved considerable costs. In 1975, the average R&D costs for one new drug were estimated at roughly 150 million. By 1987 R&D costs amounted to approximately 344 million. This further increased by 2000 to 870 million (see Exhibit 8). This implied that only around one third of all medicines actually generated revenues that exceeded the research and development costs. In general, most large pharmaceutical firms had a centralized R&D unit. This hardly changed for several years. Recently the importance of the \"new sciences\" like biotechnology, genetics, Pharmaco Genomics and Proteomics had increased leading to a growing trend of "perSOnalized medication." The \"one drug fits all\" policy, Exhibit 8 R&D Expenses of the Pharmaceuticals Industry in Europe, Japan and the US in Billion EUR at 2006 Exchange Rates Year R&D spending 1990 15.9 1995 25.8 2000 48.5 2004 51.6 Source: EFPIA 2006. DC 16 The Tools of Siroieqic Anoiqsis which previously characterized large blockbusters, could potentially expire. Medicines for specic patient groups had become more numerous, supported by further devel- opments in the research process. For example there were iterative test processes using imaging methods. These were processes that had little to do with the traditional R&D of the large pharmaceutical firms. Universities and smaller biotechnology firms increasingly ranked higher in innovations than the large pharmaceutical firms. As a result GlaxoSmithKline reacted some years previously and initiated a decentralization process in order to have more exibility at the research front. It was possible that this trend could continue for the foreseeable future. In order to provide pharmaceutical firms with an incentive to further invest in the research of new medicines despite high costs, a patent system was developed. Patents were the exclusive right to use an invention. A patent on a medicine gave the patent holder the right to prohibit others to produce, offer or use the medicine commercially. This right was in most countries limited to 20 years. Only in exceptional situations could governments use the right, regardless of the patent, to produce a medicine and make it available to patients Without the consent of the patent holder (\"compulsory licensing\"). Although patents offered a certain protection, the so- called \"between-patent\" competition posed a dangerous threat to existing pharmaceutical firms. Between-patent competition arose between branded products in the same \"Disease Class.\" Such a therapeutic area comprised drugs that had either the same chemical structure or used the same pharmacological \"mode of action\" against a disorder. Drugs from the same therapeutic area were, therefore, Exhibit 9 Top 10 Blockbusters 2005 relatively good substitutes even when the drug was still under patent protection. Most firms researched very simi lar medicines at the same time. An innovation that led a branded drug and with a new therapeutic area was called a \"breakthrough drug\" (or first-in-class). New medicines in existing therapeutic areas were "followons.\" Pzer 's Viagra, for example, was a breakthrough drug when it was launched on the market in 1998. Pfizer profited from a monopoly position and patent protection until 2003 when Bayer introduced a similar product in the same therapy class (Levitra). The times that a breakthrough product existed on the market without any competition were decreasing. First-in-class products which were authorized in the 705 survived on the market for approximately 8 years without follow-on. For products authorized between 1995 and 1998, this time period was only 1.8 years. In addition the days of excessive high profit margins were over even though \"follow-ons\" brought only limited therapeutic advantages as governments became more cost- conscious. Even in the US market, which offered 50% profit margins for many pharmaceutical firms, there were signs that the free pricing policy had ended. The special situation of the market combined with patent laws had caused most rms to earn gigantic revenues with only a few products. Products that generated more than US$1 billion in revenues were called "blockbusters.\" Firms tried to make maximum use of the patent pro tection. New globally standardized products were, there fore, registered for a patent in concerted action worldwide and brought into the market simultaneously (Exhibit 9). When patent protection ended, generics entered the competition. Often, the generics manufacturers made use -__ Therapeutic Area Revenue 2005 in billion USD _\" Product Firm Lipitor Pzer Plavix Sano-aventis/ BMS Nexium AstraZeneca Seretide / Advair GlaxoSmithKline Zocor Merck & Co Norvasc Pzer Zyprexa Eli Lilly Risperdal 1&1 Ogastro/Prevacid Abbott/Takeda Effexor Wyeth Source: IMS Health (2006). Cardiovascular 12.9 Cardiovascular 5.9 Gastrointestinal 5.7 Respiratory 5.6 Cardiovascular 5.3 Cardiovascular 5.0 Nervous system 4.7 Nervous system 4.0 Gastrointestinal 4.0 Nervous system 3.8 s still simi- led a Llled a ties in izer's it was .'om a when erapy oduct were )rized years l 1995 irgins mited : cost- prot signs . With enues 3 than .t pro- there- lwide 9). 2d the le use Case 1]: Dlizev and lhe Challenges of \"we Global Dhaemaceulicol lncluslvu DC l7 of the scientific progress since the development of an old Preparation. Consequently, generics could be significantly superior to the originally branded products in effectiveness and side effects. Generics were generally named after the international non-proprietary name of the active ingredient, with the addition of the manufacturer name. Competition for blockbusters was, therefore, extremely high. In the US for example, BMS's diabetes product called Glucophage lost patent protection in 2002. During the previous few years 19 generics competitors entered the market. Market share of the branded product fell rapidly by around 90% in a short span of time. In contrast to the innovative branded products, generics clearly had a lower profit margin as manu factur ers could forego a large part of the expensive development and test phases. These had a positive effect on the cost structure (see Exhibit 10). Therefore, many governments had taken steps to improve the market position of generics to prot from the much lower prices. The share of generics in the total drug market was very different. In the US the num- ber of generics prescriptions exceeded those for branded products for the first time in 2005. InEuropean countries as well as inJapan, generic drug markets were often still underdeveloped and offered large growth potentials. In the meantime most countrieskeven outside of Europehad initiated or implemented measures that gave preference to generics. However, not only the actions of the national health authorities drove the growth of generics' share. Many doctors and patients now had more confidence in generics. The growth of the generics business was estimated at approximately 20% which was Exhibit 10 Costs Per Category in " of Revenues for 2005 ________ Pfizer 15 - 17 GSK 14 22 Sanofi-aventis 15 26 Novarh's 15 28 18:] 12 28 AstraZeneca 14 72 Merck :8: Co 17 23 Abbott 8 48 EMS 14 31 Wyeth 15 29 Eli Lilly 21 24 Tevall 7 53 Sandozll 9 61 IVAXl) 6 58 Source: Company annual report. 1) Teva, Sandoz and Ivax are primarily generics manufacturers. higher than the expected growth rate of 5% to 8% on average for the total medicine market. The competitive pressure for the imminent generics led brand manufacturers to increasingly implement Life Cycle Strategies. The goal was to either increase the time a branded product had on the market without competition from generics; to increase the revenue a product generated under patent protection; or to minimize the loss of revenue to competing generics. Pharmaceutical firms started devel oping these strategies 6 to 8 years before the expiration of the patent. Around % of all medicines, that were in Phase III of the clinical tests in the US, did not contain entirely new chemical entities. This means that they were already sold on the market in a some other form. A more recent strategy was to bring authorized generic versions on the market. These could be marketed by the orig- inal branded drug manufacturer; by the firm's internal gener- ics division or by a generics firm that received an exclusive license for this. In case of licensing, the product was usually produced by the manufacturer to utilize full capacity. Marketing and distribution however was done by the licensee. The producer received, in addition to the licensing fee, a share of the prot. This strategy was particularly useful it generics firms had already contested the patent protection successfully. Instead of costly patent law disputes, this coop erative strategy Was a fast and acceptable solution for both sides. When Pzer '5 US patent on Zithromax, an oral anh'bi otic, lost patent protection in 2005, Pzer 's own generics divi sion brought an authorized generic on the market. At the same time, three other firms started with generics for Zithromax. After only seven weeks, the market for the branded drug collapsed and 90% of all prescribed drugs were generics. Nevertheless, Pzer was able to achieve a 49% market share with its own generic. The Supply Chain From manufacturing to consumption by the patient, a medicine went through a number of steps. Production Fine chemicals were the production base for most medi- cines. Branded products made up between ten to fifteen percent of the medicine price. Generic products comprised about 25% to 30% of the medicine price. Half of this global medicine market was manufactured by the pharmaceutical firms themselves; whereas the other half was produced by firms from the fine chemicals industry. These fine chemicals consisted of standard practice or customized molecules DC lS The Tools of Siroleqic Anolusis and active agents that were prepared for further processing into the final medicine in pill, uid or gaseous form. The fine chemicals could be seen as mass-production items or raw materials that could normally be produced by various firms in high quality. As a result, there were many potential suppliers. No chemical firm had been able to achieve a dominant market position and the market to date remains highly fragmented. The pharmaceuticals industry was by far the largest buyer of fine chemicals and a substantial percentage of chemical firms' revenues often depended on a few pharmaceutical customers. Medicine manufac- turers, on their part, must guarantee high product quality. To produce a specific medicine, every factory needed exactly defined processes and a permission that was checked regularly. If health institutions assessed that there were variations in the areas of quality, safety and effectiveness, then product authorization could be with drawn immediately. Distribution and Pricing Wholesalers and pharmacies ensured that the products reach the patients. In this area, there were large differences between the US and the European markets. In most European markets maximum mark ups for pharmacies and wholesalers were set by the health authorities. In the US, there was considerably more exibility. On average,-the medicine manufacturer received around 60% of the sales price, the wholesaler around 7% and the pharmacy about 20%. (See Exhibit 11.) The wholesalers bought directly from the drug manufacturers and distributed the product further to hospitals and pharmacies. To carry out his func- tion, the wholesalers needed a license and were required to conform to certain criteria, eg. keep a safety stock, so that 9.8% 20.4% 6.6% EXhihit li Composition of sales price Source: EFPIA 2006. they could deliver within a short time. Moreover, they often had to cover a whole regionand guarantee the integrity of the drug. Around 94% of the medicine provided in the EU was undertaken by wholesalers. Nevertheless, a multichannel system dominated Europe, in which a product could be sold by multiple wholesalers. Large pharmacy chains, spe- cialized pharmacies and mail order pharmacies could to some extent buy the medicines directly from the (medicine) manufacturer as well. The growing importance of chains and mail order houses in Europe led to an increasing trend to bypass the distributor. Hence, in February 2005, Pzer announced that it would deliver directly to pharmacies, to fight parallel imports. Price pressure on the wholesalers had risen over the previous years resulting in tighter competition. The net prot margins were decreasing and averaged around 0.7 to 0.8% of sales price. A reason for this was increasing pack- aging, delivery, and transportation costs that could be attributed to the rising oil and fuel prices. Another reason was the trend of medicine manufacturers to establish Just-In- Tirne production systems which limited the wholesalers' opportunities to profit from efficient warehouse manage- ment. As a result, the industry both in the US and Europe had undergone substantial consolidation over the last decades. In the EU-lS countries, the number of whole- salers declined from 600 in 1990 to around 150 in 2004. In US market the three largest wholesalers control approxi mately 90% of the market. I Pricing was more critical for generic manufacturers because they are traded in larger mass volumes. In particular, the competitive environment in generics for each of the respective therapeutic areas played a major role. In addition, the ability of the wholesaler to support the manufacturer in El Producer I Wholesaler E Pharmacy State (VAT and other taxes) 63.3% C059 Il: plizee UNA \"'19 Challenges Cl lhe Global Dharmoceulicol Indusl'rg DC lg revenue or volume growth as well as the prevention of par- allel imports further affected the price levels for generic drugS- Many distributors had added activities to their core business, for example, services in the areas of market data gathering and processing or packaging. For the manufac- turers, distributors increasingly offered marketing and advertising support activities as well as support in the area of logistics, which was necessary in the clinical tests, or in product launches. Some distributors had even vertically integrated, both downstream and upstream, and had taken over production and pharmacy functions. This strategy, however, was disliked by national health authorities and was highly restricted. The significance of pharmacies varied from country to country. Prescription drugs were generally only avail- able through pharmacies. But the inuence of pharmacists on the choice of drug or the brand was dependent on the respective legal environment. Principally, the decision on which medicine was consumed by patients was made by the prescribing doctor. In many countries, however, the pharmacist was allowed to replace the original pre- scribed branded product with a preparation that contained the same active agents. Pharmacies usually bought medi- cines directly from wholesalers and even this was strongly regulated in all countries. In most European countries, for example, only pharmacists could operate pharmacies. The number of pharmacies that could be owned by a single owner was limited. A license was required. Over the last years, however, there had been tendencies to lighten this regulation. Exhibit 12 Top 10 Pharmaceutical Firms 2006 Competition among Pharmaceutical Firms In comparison to other industries, the pharmaceuticals industry was highly fragmented. Over the previous few years there has been a tendency for firms to consolidate. In 1988 the top ten pharmaceutical firms had a market share of around 25%; whereas, in 1996 the same group held around 33% of the market. As more mergers and consolida- tions occurred, it was reported that by 2006 the market share of the top pharmaceutical rms improved to 43.3%. All top ten rms were researchoriented companies (Exhibit 12). Only Sanofiaventis and Novartis included a large generics domain into their activities. Others were also active in the OTC market, diagnostics, and in non-medical consumer goods. Overall, most firms were highly vertically integrated compared to other industries and carried out R&D, production, marketing and distribution activities. Some experts, therefore, claimed that these firms should focus more on their specic core competences, such as R&D or marketing & sales, make use of contract research and independent development firms as well as incorporating freelance marketing organizations into their business. Pfizer was the undisputed market leader. Its core business consisted of 86% prescription drugs for humans. The division \"Consumer Health Care\" which included personal hygiene and OTC-products (approximately 8% of total revenues or US$41 billion) was sold to Johnson 8: Johnson in June 2006 for US$166 billion. Four percent of ____________--- ___________.___ 2006 Revenue Growth Average Annual Company Origin (in billion US$) 20052006 (in /o) Growth 2001-2005 Pfizer USA 46.1 O.7 4.8 GlaxoSmithKline UK 37.0 5.5 5.0 Sano-aventis France 31.1 1.4 11.2 Novartis Switzerland 31.6 6.1 14.1 Johnson & Johnson USA 27.3 1.2 9.2 AstraZeneca UK 26.7 11.2 _ 7.0 Merck 8:: Co USA 25.0 4.9 4.1 Roche Switzerland 23.5 16.1 13.5 Abbott USA 17.6 6.4 10.7 Amgen USA 16.1 20.6 30.2 Total Top 10 ' 282.1 5.7 8.8 Source: [MS Health 2006. PC 1-10 The Tools of Strategic Analysis Exhibit 13 Size and Development of R&D Spending Exhibit 14 Number of Developed New Molecular Entities for Selected Industries (NMEs) and Biotechnology Products Between R&D spending in % 1997 and 2004 Industry of revenue 2004 Year Number of new NMEs Pharmaceutical industry and 15.3 1990 Biotechnology 1991 51 Software and Computer Services 10.7 1992 43 IT Hardware 8.6 1993 40 Automotive 4.3 1994 40 Electronics and Electrical Equipment 5.6 1995 41 Chemicals Industry 3.7 1996 36 Food Industry 1.8 1997 46 Telecommunication 1.5 1998 37 Average of all industries 3.8 1999 41 Source: EFPIA 2006. 2000 32 2001 31 2002 28 2003 26 Pfizer's revenue was generated by the division "Animal 2004 25 Health Business." Pfizer was most active in the cardio- Source: EFPIA 2006. vascular diseases and metabolism diseases therapeutic areas. Close to half of the company's total revenues were generated from prescription drugs. In the meantime, Co., Sanofi-aventis operated a Joint-Venture in Europe in Pfizer had divested its generics business which had been the OTC and the vaccine products. previously integrated into the company after the acquisi- Novartis' business was divided into three main seg- tion of Pharmacia in 2004. Instead, it had bought some ments, namely: Branded products (innovative prescrip smaller biotechnology firms. The patents for its second tion drugs that contributed 63% of revenues in 2005) and and third best blockbusters, namely, Zoloft and Norvasc generics, which represented 15% of the revenues and expired at end of 2006 and 2007 respectively. were marketed under the name Sandoz. Both were grouped GlaxoSmithKline (GSK) was somewhat more differ- together in the pharmaceuticals division. The third entiated. The pharmaceuticals division was responsible for branch was the Consumer Health Care division that con- 86% of the revenues. The remaining 14% was contributed sisted of the OTC business, animal products, baby food, by the consumer goods and OTC division. Therapeutic food supplements and contact lenses. During the previ- focus concentrated on respiratory diseases (27% of rev- ous years Novartis expanded primarily through acquisi- enue), nervous system diseases (17.2%) and antiviral drugs tions such as Sandoz (the Slovak manufacturer LEK in (13.9%). GSK is currently expanding in the vaccine busi- 2002), the generics business of AstraZeneca (2004), the ness (7.4% of revenues in 2005) and is broadening its biotechnology base by acquiring several smaller firms. For German firm Hexal (2005), Eon Labs (2005) and Chiron (2006) for the vaccine and diagnostic branches. The two of the top five products, new generics had recently Consumer Health Care division was also restructured by appeared on the market. In the OTC market, GSK was the purchase of the foods business as well as the presently number 3 worldwide. Consumer Health division of Bristol-Myers Squibb (2004). Sanofi-aventis was a firm that emerged from the At the same time, however, the dietary products division merger between Sanofi-Synthelabo. This was the result of and further food divisions were sold off. earlier multi-mergers between Hoechst and Rhone-Poulenc Johnson & Johnson (J&]) was a highly differentiated and Aventis. Sanofi-aventis was dominated by its pharma- conglomerate and was highly decentralized. The pharma- ceuticals division (92% of revenues). The remainder was ceuticals division contributed only around 44% of the rev- generated by the vaccine business. The firm was active in enues. About 18% of total revenues were generated by the seven different therapeutic areas. The pharmaceuticals Consumer division which encompassed the OTC products, division included a generics department, which covered food products and supplements, skin care, and children's only 14 European countries. In March 2006, around 25% of products. Within the pharmaceutical division, the therapy the Czech generics manufacturer Zentive, a leading firm in focus was on nervous system disorders, anti-inflammatory Central-Eastern Europe, was bought. Together with Merck & drugs and hormone treatments. J&J had bought firms forCase 1-1: Pfizer and the Challenges of the Global Pharmaceutical Industry PC 1-11 Exhibit 15 Share of the Top 5 Products in the Total Revenue in Percent Firm Product 1 Product 2 Product 3 Product 4 Product 5 Eli Lilly Wyeth 29 18 BMS 20 Roche 12 Merck & Co 20 19 14 AstraZeneca 7 12 J&J Novartis 11 Sanofi-aventis 8 GSK 14 Pfizer 24 WWWVAUTUTOR S w w or W W UNI W UT ID UT Source: Company annual reports 2005. all its business areas over the last years. In the OTC market, transplant pharmaceuticals. In 2004 Roche sold off the J&J was the global market leader. Consumer Health division to Bayer. Acquisitions were AstraZeneca operated only one division: pharmaceu made in the area of biotechnology. Novartis owned one third In ticals. The five main therapeutic areas were gastrointestinal stake in Roche. diseases (27% of total revenues), cardiovascular (23%), neu- The US firm Abbott realized 61% of its revenues eg- roscience (17%), oncology (16.5%) and respiratory diseases from the pharmaceuticals division. The remaining rev- ip- 12%). In the beginning of 2006 AstraZeneca acquired the enues were contributed by the diagnostics and the food nd biotech firm KuDOS. nd The US firm Merck & Co had long been considered products. Abbott owned 50% of TAP pharmaceuticals, a Joint-Venture with the Japanese firm Takea. During the last ed as the largest pharmaceuticals firm globally. The firm still suffered the consequences of the premature market with- years Abbott made some acquisitions, mainly to strengthen ird the area of medical devices (stents) and diagnostics. on- drawal of the arthritis product Vioxx in 2004. Vioxx was Bristol-Myers Squibb (BMS): almost 80% of the total ed, launched in 1999. Merck sold over US$2.5 billion worth of this arthritis drug in 2003 alone. Ongoing tests, however, revenues was generated by the pharmaceuticals division. vi- BMS had a strong presence in the field of cardiology, virol- isi- showed a heightened risk of a heart attack for Vioxx, which in led to the immediate withdrawal of the license. Because of ogy and oncology. In the future BMS wanted to specialize the this, Merck became a takeover target on the stock market even further in "Specialty Products." In 2004, the adult on with its stock price dropping almost 30% on the day of the nutritional division was sold to Novartis. In addition the Consumer Medicines Business was divested in 2005. 'he announcement. By 2008, two more important products The expiry of the patent for a blockbuster Pravachol in 2006 by would lose patent protection. Merck operated almost the exclusively in the area of prescription drugs (95% of rev- combined with the difficult market conditions resulted in weaker financial results for BMS. Another burden for the 14). enues). Merck was the only top ten firm that had not been company was the lost patent law suit against a Canadian lon involved in the large horizontal merger over the last 15 years. In 2004, Merck sold its 50% stake in a European generics firm for the blockbuster drug Plavix. ted Joint-Venture of non-prescription pharmaceuticals to its na- partner J&J. Roche's pharmaceuticals division contributed 77% to Pfizer's Future Strategy ev- the total revenues. The most important division for the com- Kindler announced a radical change in strategy that would sts, pany was the diagnostics area. However, a large part of the encompass multiple divisions and Pfizer's corporate cul- n's sales (about 1/3) originated from the consolidated majority ture: He was quoted in an article as commenting: "There py stake in the US biotech firm Ganentech and the Japanese firm Chugai. Roche was the market leader in oncology are no longer sacred cows." This was very uncommon for ory with 40% of revenues based on anti-cancer medicines. 15% the hitherto profitable industry. for of total revenue was contributed by virology and 8% by In January 2007, he announced that 10,000 employees would be dismissed. This was around 1/10 of Pfizer's totalPC 1-12 The Tools of Strategic Analysis employees. One fifth of the sales force in the US and in referred to as the "pipeline") be broadcasted via the inter- Europe had to go. Five research centers and several facto- net to provide the public and competitors with relevant Ca ries were closed down. Research was reorganized. Instead information to foster focused collaboration or acquisitions. of globally dispersed "Centers of Excellence," research Finally, Kindler demanded a paradigm shift regarding the activities were structured around five therapeutic areas product portfolio: "We need to be as effective at selling a (e.g. Cancer, Diabetes). In the future Pfizer had to minimize large number of US$500 million drugs as we are at selling losses in research and development costs resulting from the drugs with multi-billion dollar sales."5 delayed identification of potential long lasting side effects Would all this help Pfizer? Would collaborative As rec such as in the case of Torcetrapib. To achieve this, Kindler research and streamlining Pfizer's existing operations prove little 1 wanted to integrate General Electric's "fast falling" policy. effective? The stock market appeared to be skeptical. In con- stores In addition, Kindler aimed to encourage his "traditionally trast to normal financial market reactions to similar corpo- In less isolated" researchers to do more external collaboration. He rate announcements, Pfizer's stock price fell after the larges had already ordered that Pfizer's research initiatives (often announcement of employee cuts. revent Kmart Yet an accou chand Bibliography cent o put W 1. Annual Reports of the pharmaceutical firms mentioned in the text. 2. DiMasi, Joseph A. (2001): "New drug development in the United States from 1963 to 1999." In: Clinical Pharmacology & Therapeutics, 69/5 (May 2001), 286-296. 3. EFPIA (2006): "The pharmaceutical industry in figures. 2006 editor." European Federation of Pharmaceutical Industries and Associations, www.efpia.org 4. IMS Health (2009): "Global Pharmaceutical Sales, 1999-2008." Top-Line Industry Data-Global. 5. Organization for Economic Cooperation and Development (2005): "Health at a glance. OECD-indicators 2005." Organization for Economic Cooperation and Development (2006): OECD Health Data 2006. 7. The Economist (2007), Billion dollar pills. The Economist Newspaper Limited, London 2007, January 27, 2007. Wal-1 believ cult to Wal-1 Endnotes woul 1. Quoted directly from the article "Billion Dollar Pills" in The Economist, January 27, enjoy 2007. const 2. Ibid. retail . Note to reader: The OTC market will not be further discussed within the parameters all er of this case study. The focus of this case is primarily on prescription drugs five 4. Quoted directly from the article "Billion Dollar Pills" in The Economist, reach January 27, 2007. had 5. Ibid. not c toma proc from othe Clut lead *Thi class