Answered step by step
Verified Expert Solution
Link Copied!

Question

1 Approved Answer

Part 1: Confidence Interval with M&M's - 26 points 1. (2pts) Which M & M color had the highest count in your sample? (If there's

image text in transcribed

image text in transcribed
Part 1: Confidence Interval with M&M's - 26 points 1. (2pts) Which M & M color had the highest count in your sample? (If there's a tie, just choose one). Fill out this table for that color. (Give 3 decimal places for p) Blue M&M's in Your Bag X = 10 n= 39 p = .25641026 2. (6pts) Verify whether all the requirements for constructing a confidence interval for the proportion of this color of M&M's are satisfied. Show work and/or explain each one. (Note: If typing, use an equation editor)| 3. (2pts) Use the StatCrunch file MAT 133 (FA21) Random Confidence Levels to generate a random confidence level for #4 below. (Use Data - Sample, then choose the "Confidence Levels" column and a sample size of 1 then click Compute!) State the confidence level here: 4. (6pts) Regardless of whether or not the requirements were met, construct a confidence interval for the proportion of M&M's that are your color from #1 using the confidence level generated in #3. (Show formula, substitution, and result - Note: If typing, use an equation editor)

Step by Step Solution

There are 3 Steps involved in it

Step: 1

blur-text-image

Get Instant Access to Expert-Tailored Solutions

See step-by-step solutions with expert insights and AI powered tools for academic success

Step: 2

blur-text-image

Step: 3

blur-text-image

Ace Your Homework with AI

Get the answers you need in no time with our AI-driven, step-by-step assistance

Get Started

Recommended Textbook for

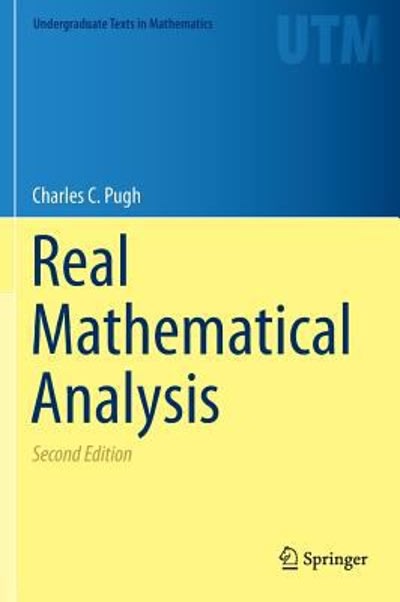
Real Mathematical Analysis

Authors: Charles C Pugh

2nd Edition

3319177710, 9783319177717

More Books

Students also viewed these Mathematics questions

Question

8. What values do you want others to associate you with?

Answered: 1 week ago